Network Performance Analysis: Target — Confusion Matrix
A network modeled for the prediction of a target variable can be evaluated by computing its Total Precision. The Total Precision is the ratio of correct predictions to the total number of cases. This measure is useful, but it can be too general for many purposes. The Confusion Matrix provides further detail about the model’s predictive performance. In this matrix, the predictions of the model are shown in the leftmost column; the top row shows the actual values in the data.
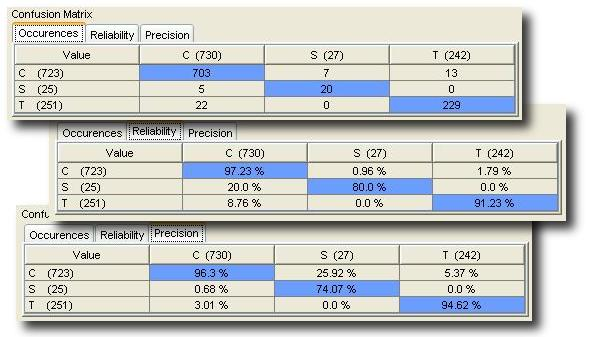
In the following example, the model predicted the “C” state 723 times, whereas there are 730 actual “C” states in the data. For “S”, it’s 25 predicted versus 27 actual. Finally, for “T”, it’s 251 predicted versus 242 actual.
Three matrix views are available:
- Occurrence Matrix: number of cases for each combination of predicted versus actual values. For three states, this would generate a 3x3 matrix. The diagonal indicates the number of true positives.
- Reliability Matrix: each cell in the matrix shows the number of occurrences divided by the sum of occurrences in the corresponding row. It can be interpreted as, “given that my model predicts state ‘S’, what is the probability that the true value is ‘S’ (or any other state), i.e., how reliable is the prediction.”
- Precision Matrix: each cell in the matrix shows the number of occurrences divided by the sum of occurrences in the corresponding column. We interpret this as, “given that the actual value is state ‘S’, what is the probability that the predicted value is ‘S’ (or any other state).”
By right-clicking on any of the matrix views, you can copy its content, including headers. You can then paste the matrix directly as a graphic (bitmap or vector) into a document, or as a data table into a spreadsheet.