Arc Confidence
Context
- The menu item
Main Menu > Tools > Resampling > Arc Confidencelets you compute a frequency value that measures the robustness of each arc. - The network must have an associated dataset, and Validation Mode must be active.
For this purpose, the Jackknife method is used. It consists of splitting the database into k samples of equal size, but before this step, the database is shuffled to avoid bias from a sorted database. In this context, k-1 samples are used to learn a network per fold (k networks total), while the kth sample is held out.
If the initial database is stratified, then the generated database will be stratified in the same way.
The structural coefficients are updated for the new networks in the following way:
where:
- is the structural coefficient of the current network.
- is the sum of the weights of all the observations described in the dataset.
- is the sum of the weights of the observations contained in subset .
Parameters
In the following window, the learning algorithm is selected, as well as the number of data samples to be generated.
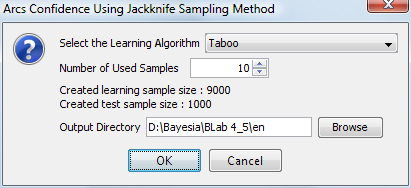
The window displays the sample size based on the size of the database and the number of samples. The samples are chosen randomly to avoid errors that can occur when the database is sorted.
All networks and databases learned during the Jackknife process can be saved in the output directory.
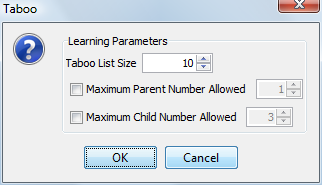
Depending on the chosen learning algorithm, a dialog box displays specific settings:
Analysis Report
Once the networks have been learned on each data sample, the following report is displayed:
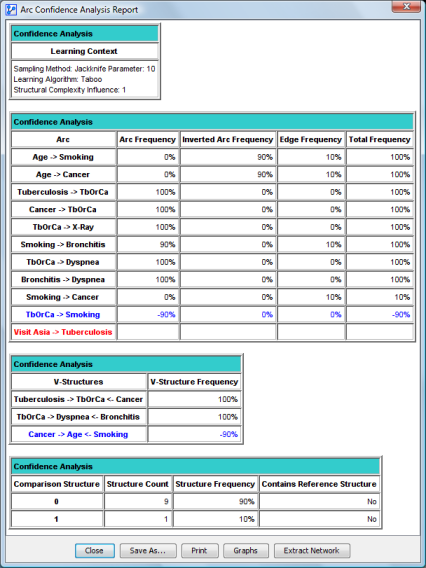
It is composed of four parts:
-
The learning context: Summarizes the learning method and the number of data samples. It also indicates the structural complexity coefficient used (it is the same as the one used in the initial network).
-
Arc confidence analysis: Lists arcs grouped by three color types.
- Black: the arcs that exist both in the reference structure and the sample networks.
- Arc frequency represents how often the arc appeared with the same orientation as in the sample networks.
- Inverted arc frequency represents how often the arc appeared with the reverse orientation as in the sample networks.
- Edge frequency represents how often the arc appeared without any orientation as in the sample networks (the equivalence class of the learned networks is used).
- Total frequency is the sum of all previous ones. It indicates the overall strength between the variables.
- Blue: the arcs that exist in at least one sample network but that do not exist in the reference network. In this case, the frequencies are displayed with a negative value. The reference orientation of the arc is arbitrarily set to the first arc found in the first sample network.
- Arcs frequency represents how often this arc appeared with the same orientation as the first.
- Inverted arc frequency represents how often this arc appeared with the reverse orientation compared with the first.
- Edge frequency represents how often the arc appeared without any orientation (equivalence class).
- Total frequency is the sum of all previous ones. It indicates the overall strength of a relationship that does not exist in the reference network.
- Red: arcs that exist in the reference structure but that have never been found in any learned sample.
- Black: the arcs that exist both in the reference structure and the sample networks.
-
V-Structures confidence analysis: Lists V-Structures grouped by three color types:
- Black: V-Structures that exist both in the reference structure and the sample networks.
- Blue: V-Structures that do not exist in the reference structure but appeared at least once in a sample network. Frequencies are displayed with a negative value.
- Red: V-Structures that exist in the reference network but that never appeared in any sample network.
-
Comparison structure array: Summarizes all learned networks from the samples. When identical structures exist, they are grouped.
- The first column is the structure identifier.
- The second column is the number of identical structures learned.
- The third column represents the frequency of the whole structure: it is the number of times the current structure appears divided by the total number of structures.
- The last column indicates whether the reference structure is included or not in the current structure.
The report can be saved as an HTML file. It can also be printed. Two other options exist: displaying graphs and extracting the network.
Graphs
The Structure Comparison button from the report allows displaying the graphical structure comparator. With this tool, data contained in reports can be viewed and interpreted easily.
Extracting the Network
The Network extraction button from the report displays the network extraction tool. This tool allows building a network from any structure depending on arc frequency thresholds.