Box Plot
Context
- The Box Plot chart in BayesiaLab represents a classical box-and-whisker plot that is commonly used in descriptive statistics for analyzing distributions of numerical variables.
Usage
-
You can access the Box Plot function in multiple ways:
Main Menu > Data > Charts > Box Plot.Node Context Menu > Charts > Box Plot.
-
In the Parameter panel, select one or more variables from the Continuous Variables dropdown list.
-
If you had nodes selected when you opened the Charts window, the variables in the dropdown menu are restricted to that selection.
-
To choose multiple variables, use
Ctrl+Click(Windows) orCmd+Click(Mac). -
Optionally, pick a variable from the Selector Variable dropdown menu. Using a Selector Variable, you can show multiple Box Plots for subgroups side by side.
-
Click
Show.
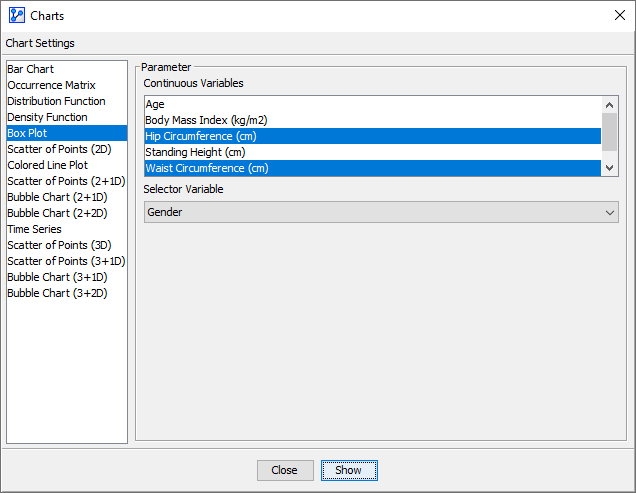
Chart Details
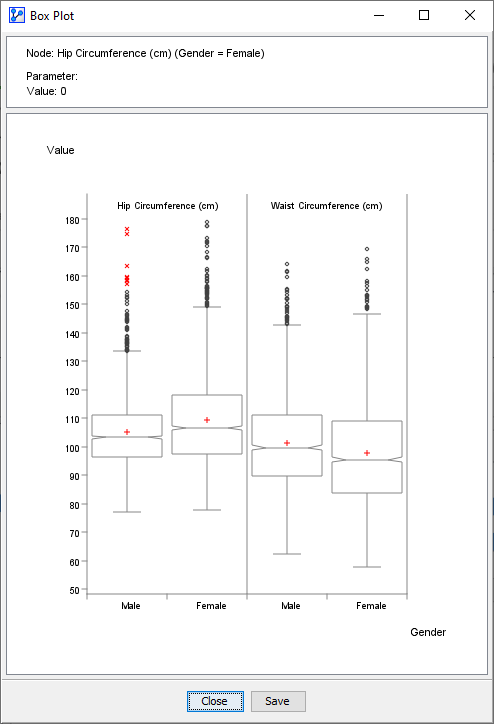
The chart includes the following visual marks in the main chart area:
- First Quartile Q 1
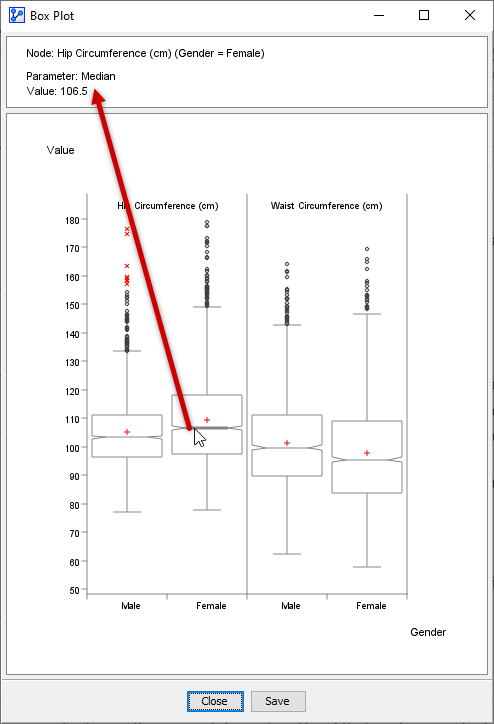
- Median Q 2
- Last Quartile Q 3
- Minimum, i.e., the lowest datum still within 1.5 of the Interquartile Range IQR= Q 3 − Q 1 of the first quartile.
- Maximum, i.e., the highest datum still within IQR= Q 3 − Q 1 1.5×IQR of the last quartile.
- Notches, which are useful in providing a rough indicator regarding the significance of the difference of medians:
- the First Notch, Q 2 −1.58× IQR N , where N is the number of observations.
- the Last Notch, Q 2 +1.58× IQR N , where N is the number of observations.
- Mean
- Lower Suspect Values, i.e., within the Minimum and Q 1 −3×IQR
- Upper Suspect Values, i.e., within the Maximum and Q 3 +3×IQR
- Lower Extreme Values, i.e., below Q 1 −3×IQR
- Upper Extreme Values, i.e., above Q 3 +3×IQR
For a clearer view of the details, the chart content is presented separately with annotations.
Information Panel
In addition to the main chart area, the Information Panel at the top explains each element as you hover your cursor over it.
Zoom Function
- To zoom in to the chart, click and hold the left mouse button. Drag the cursor to designate the area to focus on. Then, release the mouse button.
- To revert to the default zoom level, double-click anywhere on the chart.
