Influence Analysis wrt Target Node
This tool generates histograms for analyzing the posterior probabilities of the Target Node by automatically setting hard evidence on each state of the selected nodes (or all non-translucent nodes when no nodes are selected).
The histograms are updated dynamically upon manually setting evidence, with the upper-left part of the window describing the current evidence set as well as the computed probabilities.
Example
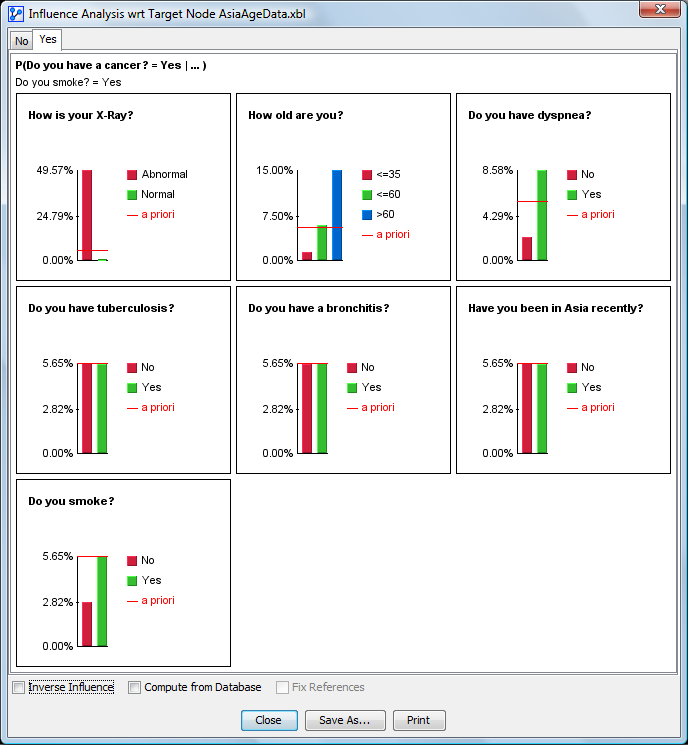
In the example below, the Target Node is , and we have selected the Target State via the tab.
The histograms show the posterior probabilities of given hard evidence on each state of the nodes. The red line a priori indicates the probability of with the current context, i.e., before automatically setting hard evidence on the node states.
Inverse Influence
Checking Inverse Influence generates histograms for analyzing the posterior probability distributions of the selected variables, given hard evidence on the Target States.
Example
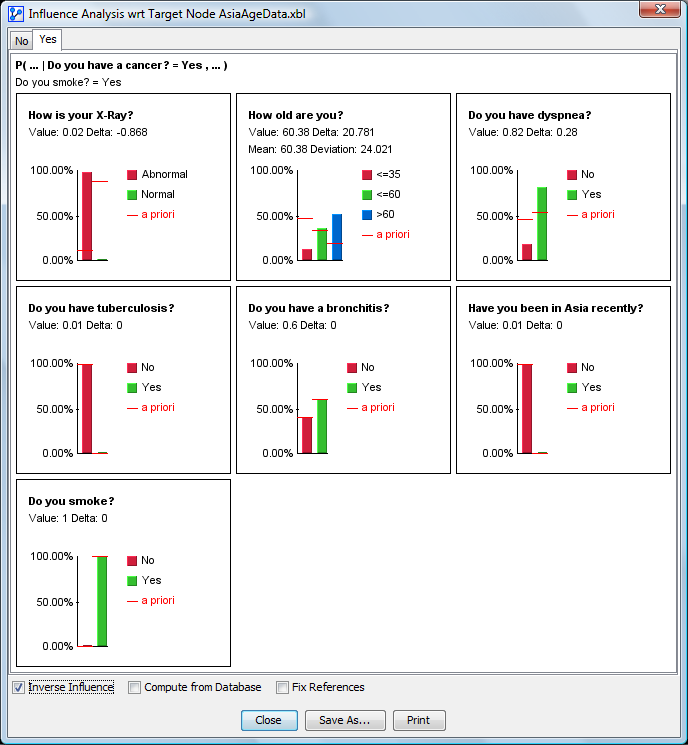
The example below shows the posterior probability distributions of each node after setting . The red line indicates the probability of the states with the current context, i.e., before automatically setting hard evidence on the Target State.
The nodes’ current values and delta are displayed in each histogram.
Compute from Database
Checking Compute from Database allows generating these histograms by directly estimating the probabilities on the associated dataset, i.e., without performing inference in the Bayesian network. When the nodes are directly connected to the Target, the results with the data and inference are the same. They only differ when the path is indirect and/or when the probabilities have been estimated with Smoothed Probability Estimation.
Fix References
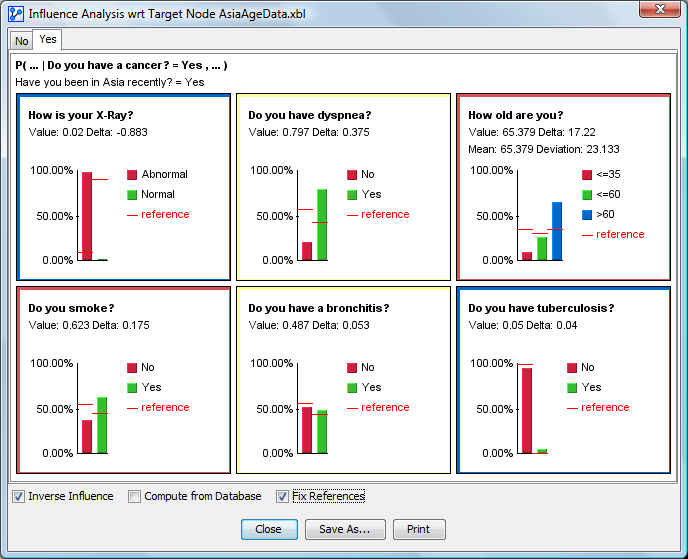
When Inverse Influence is checked, Fix References replaces the a priori (red lines) with the current probabilities and keeps these references unchanged when evidence is manually set.
The deltas are computed with respect to the references. As shown in the example below, when nodes have associated colors, the border of the graphs inherits the corresponding color.
Example
Tooltip
Hovering over a bar chart brings up a tooltip with the state’s name and its associated probability.
Context Menu
With the Context Menu, you can:
- Sort the nodes based on:
- Their internal order, or, when the nodes are monitored, the order used in the Monitor Panel;
- The Mutual Information with the Target Node;
- The Binary Mutual Information, i.e., the mutual information with the Target State.
- Show the Long Name of the nodes.
- Show the Long Name of the states.
- Copy an image from the graph.