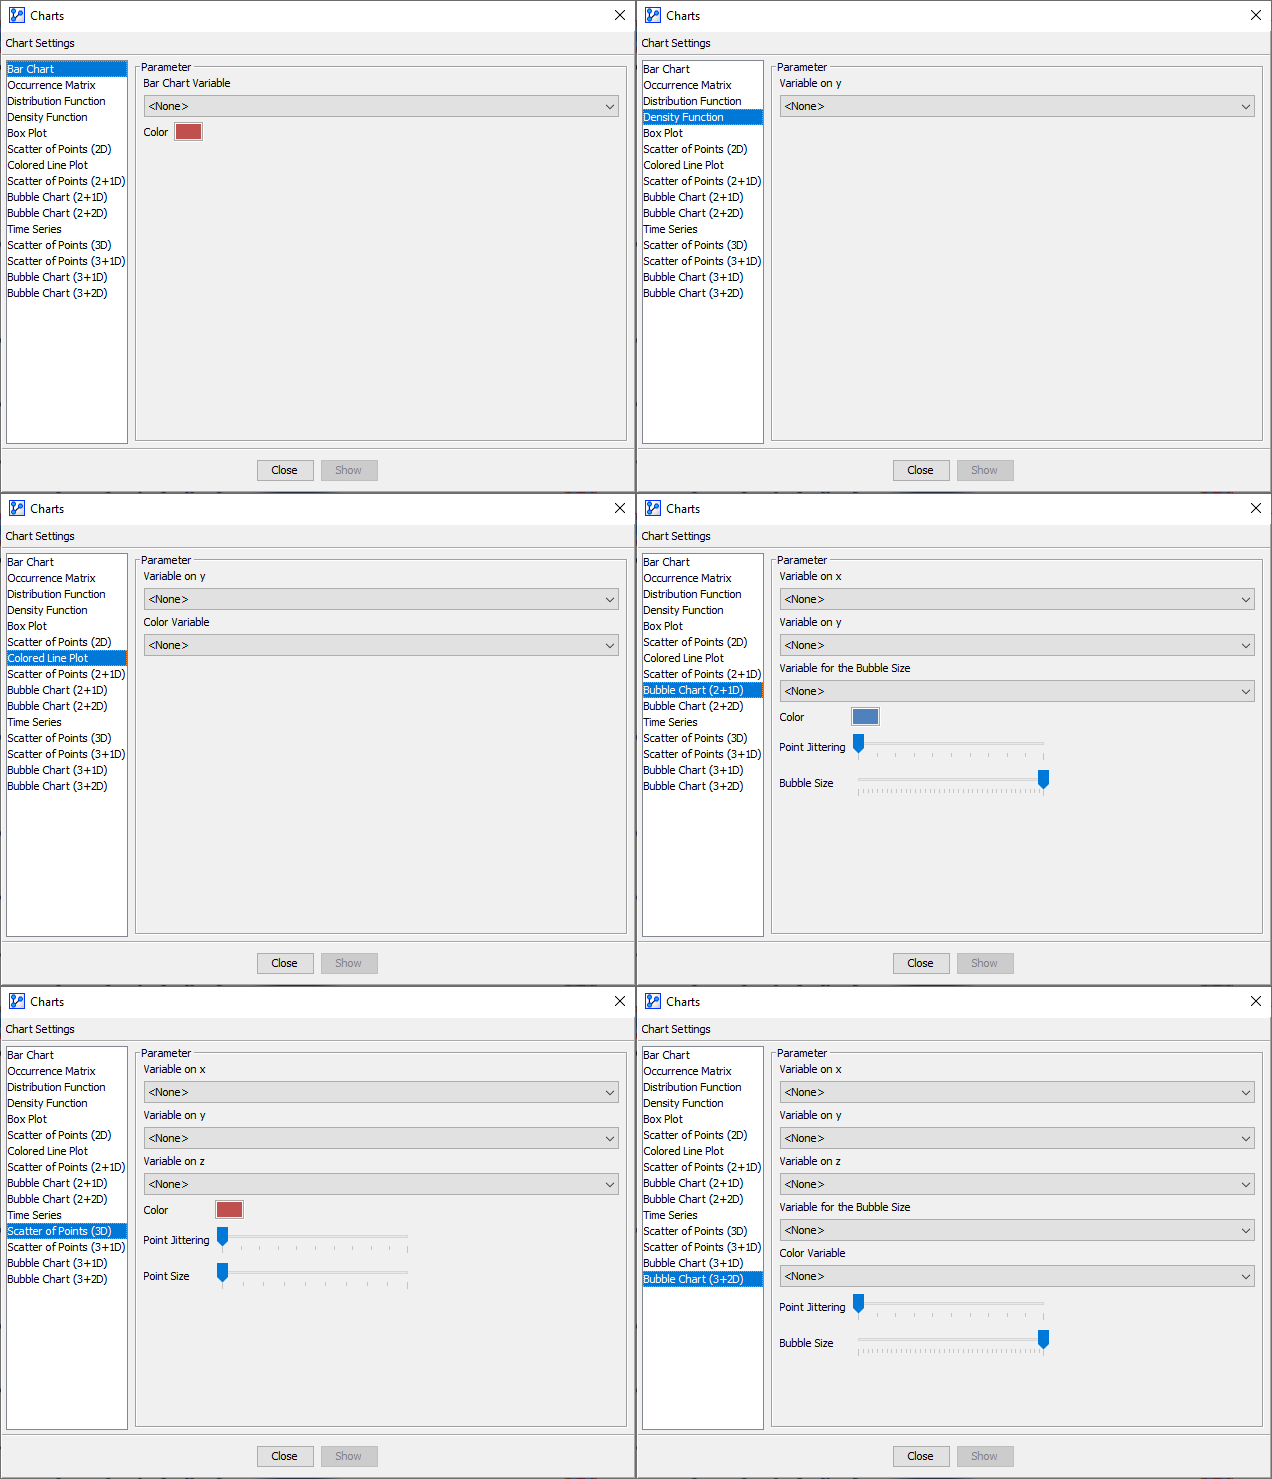
Charts
Context
- With the Charts function, you can plot variables from the dataset associated with the Bayesian network. If no dataset is associated, Charts is not available.
- In earlier releases of BayesiaLab, all plotting functions were arranged in the “Graphs” menu, which is now deprecated. For a clearer differentiation between network graphs and data graphs, the plotting functions are now available in the Charts window.
In the context of Charts, we refer to variables rather than nodes to emphasize that we are plotting the actual values of the variables rather than discretized node states.
Usage
- You can access Charts in multiple ways:
Main Menu > Data > Charts.Node Context Menu > Charts.
- The Charts window opens and provides a wide range of plotting options.
- If you had nodes selected when you opened the Charts window, the variable dropdown menus are restricted to that selection.
- Some of the charting functions only apply to continuous variables.
- If the dataset contains a split for learning and test data, you can choose which set you want to display, i.e., learning data, test data, or the entire dataset.

