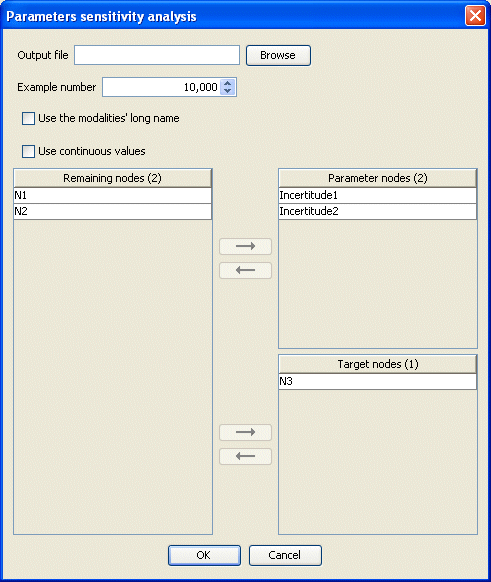
Parameter Sensitivity Analysis
This function uses sampling to compute the impact of uncertainty in the parameter nodes with regard to the target nodes. By default, the parameter nodes are root nodes (i.e., nodes without parents), and the target nodes are leaf nodes (i.e., nodes without children).
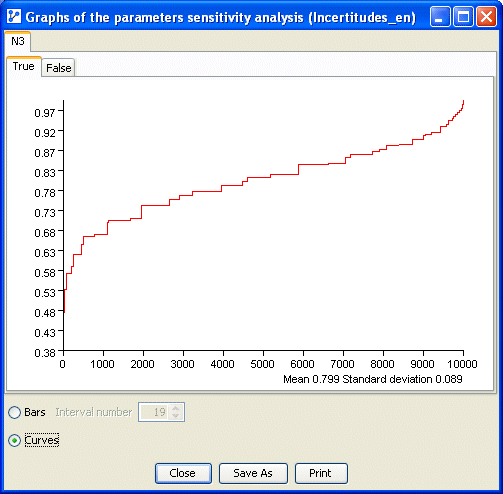
The result of this simulation can be saved to a file. The analysis is presented with a curve that represents the cumulative distribution function of the probabilities of each state, plus a bar chart representing the probability density function. In addition to these graphical results, the mean and the standard deviation of the probabilities of the target states are also given. The mean corresponds to the marginal probability displayed in the monitors.

The analysis can be performed on all nodes or on a subset of selected nodes. Translucent nodes are not taken into account in this analysis. If applicable, the evidence context is taken into account and shown under the graphs.
The context menu allows you to display node comments instead of node names, as well as the long names of states. You can also copy the chart as a graphic.