Cluster Interpretation: Histograms
Background & Context
- On this page, we present the Histograms for cluster interpretation as an alternative to Most Relevant Explanations for Cluster Interpretation.
- To provide further context for Most Relevant Explanations for Cluster Interpretation, we compare several other approaches that can help interpret individual Clusters:
- Setting Evidence for Cluster Interpretation: Posterior Distributions, Relationship with Target Node, Mosaic Analysis, Posterior Mean Analysis, Segment Profile Analysis, Histograms, Tornado Diagrams
- Optimization for Cluster Interpretation: Dynamic Profile, Target Optimization Tree
- More specifically, we compare all these approaches with regard to characterizing the state of the Cluster Node in the reference network.
- All analyses and instructions on this page refer to this reference network, which you can download here:
MaleClusters.xbl
Histograms
- To launch Histograms, select
Main Menu > Analysis > Visual > Target > Target's Posterior > Histograms. - A new window opens with one panel for each manifest node. At the top of the window, we can select the Cluster of interest, which is in our case.
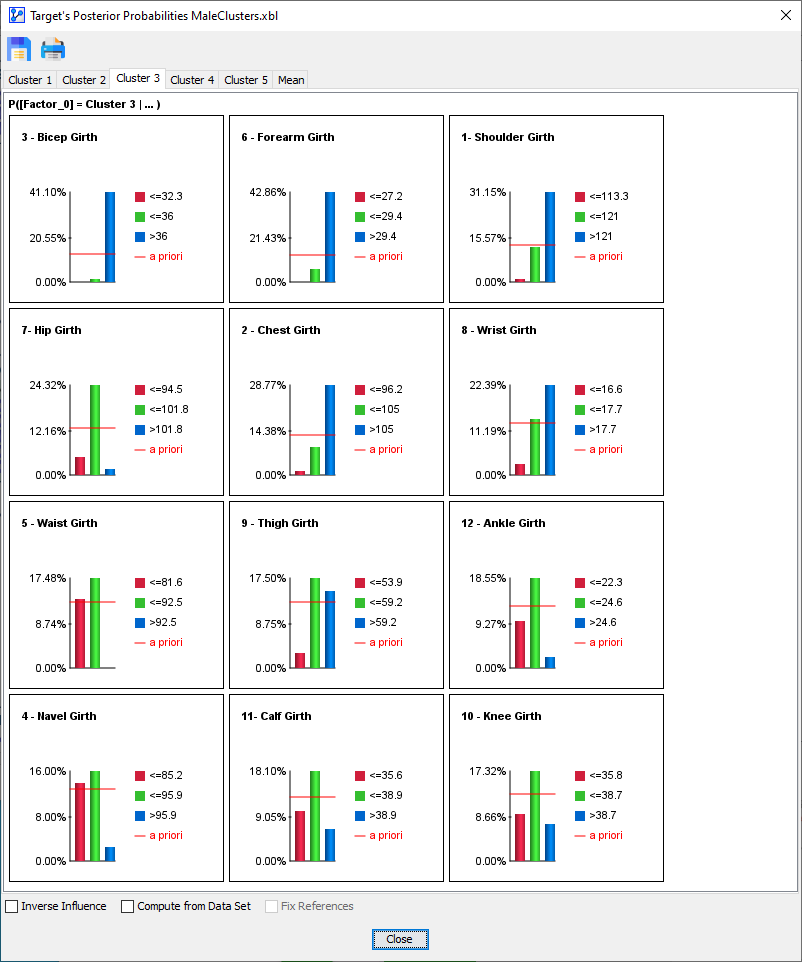
- To explain the precise meaning of the panel content, we focus on the panel for the node .
Loading SVG...
- The probability that an observation, i.e., an individual from the population, belongs to is:
- 9.23%, if
- 17.32%, if
- 7.27%, if
- The a priori probability of belonging to is 12.96%, as indicated by the red line.