Targeted Cross-Validation
Context
- Targeted Cross-Validation lets you evaluate the current network with targeted cross-validation.
Requirements
- The network must have an associated dataset.
- Validation Mode must be active.
- The network must have a target variable.
For targeted cross-validation, the k-fold method is used. It consists of splitting the database into k parts (the folds) and using k-1 folds to learn a set of k networks. Before this step, the database is shuffled to avoid bias from a sorted database. For each network, the kth fold is used to test the network and measure its predictive performance. For each learned network, the continuous variables are re-discretized according to the variable distribution in the fold. The discretization method is the same as the one used for the reference network. By contrast, initial aggregations are kept.
If the initial database is stratified, then the generated database will be stratified in the same way.
The structural coefficients are updated for the new networks in the following way:
where:
- is the structural coefficient of the current network.
- is the sum of the weights of all the observations described in the dataset.
- is the sum of the weights of the observations contained in subset .
On this basis, the network structures are learned using the chosen algorithm, and the network’s targeted network performance is computed.
Parameters
The learning algorithm and the number of folds are selected in this dialog box:
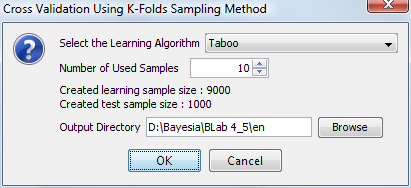
The sample size is calculated based on the size of the database and the number of folds. The samples are chosen randomly to avoid errors that can occur when the database is sorted.
An output directory can be specified where all intermediate networks learned from the folds will be saved with their corresponding datasets.
Results
The network’s targeted performance is displayed in this window:
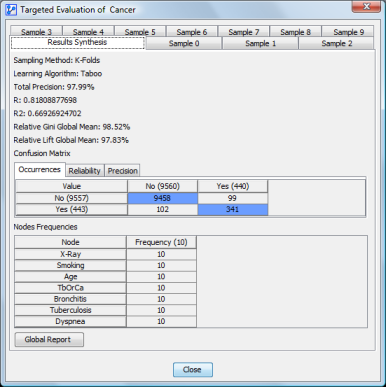
The first panel, “Results synthesis,” displays the global results computed on all samples for:
- global precision
- R: Pearson’s coefficient
- R2: squared Pearson’s coefficient
- relative Gini value
- relative Lift value
- confusion matrices: for occurrences, for reliability, and for precision
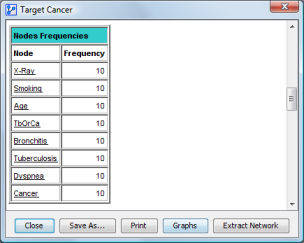
The node frequency array indicates how often a node appears in any network built from a fold (whether or not it is directly connected to the target node).
The Global Report button (in the synthesis panel) displays the Cross-Validation Synthesis Report.
The tabs contain the targeted performance results of each network learned on the folds:
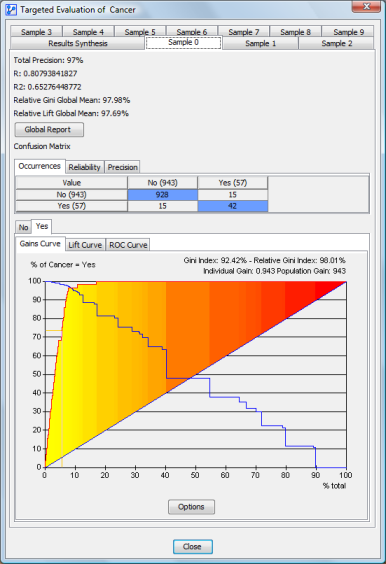
The details about the panel contents can be found in the targeted performance report section.
Global Analysis Report
Once all the networks are learned, the following report is generated:
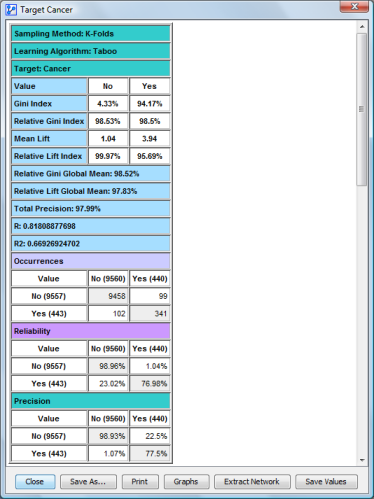
The report is built on the same template as the Global Targeted Evaluation Report, except that it summarizes all values for each index and each matrix calculated for each fold.
The rest of the report contains the node frequencies.
The last part of the report contains a structural comparison of the reference network with the generated networks:
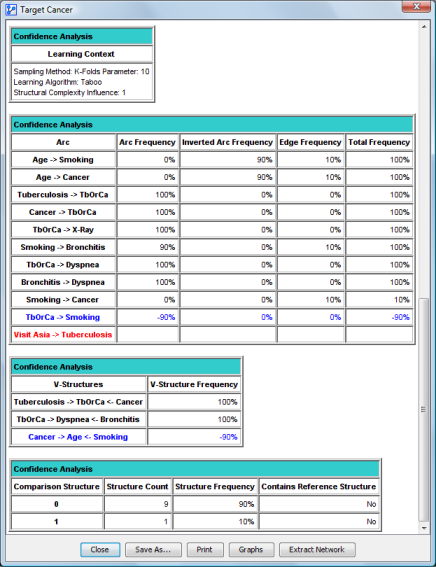
Its contents are the same as the Arc Confidence analysis.
This report can be saved as an HTML-formatted file and can also be printed. Two other options exist: displaying graphs and extracting the network.
Graphs
The Graphs button from the report lets you display the graphical structure comparator. With this tool, data contained in reports can be viewed and interpreted easily.
Extracting the Network
The Network extraction button from the report displays the network extraction tool. This tool allows building a network from any structure depending on arc frequency thresholds.
Saving the Values
The Save Values button of the report lets you save the numerical values of the target predicted by each network on its corresponding test set to a file.