Most Probable Explanation
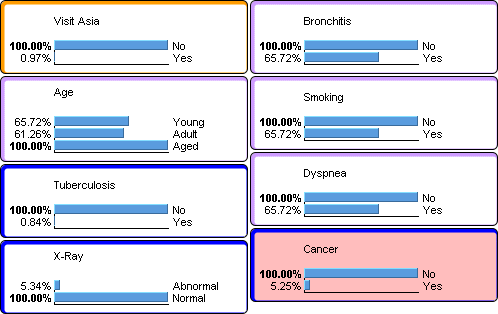
This tool allows you to compute the Most Probable Explanation, i.e., the case that has the highest joint probability in a given network. The Monitors highlight this case. The probability of each state is replaced by the likelihood that the corresponding state belongs to the most probable case. The context (i.e., the set of evidence) is taken into account during the analysis. Each time a piece of evidence is set, the Most Probable Explanation is recomputed and the Monitors are updated accordingly. The joint probability displayed in the upper part of the Monitors window corresponds to the joint probability of this Most Probable Explanation.
The means and the standard deviations of the continuous nodes are no longer computed and displayed. The same applies to the Mean Value, the Total Value, and, if necessary, the uncertainty and likelihood values, which are no longer computed or displayed in the information panel.