Target Interpretation Tree
Concept
- The Target Interpretation Tree generates an “ideal evidence accumulation” tree, which can help interpret the Target Node.
- The Target Interpretation Tree displays the optimal sequence in which you should seek observations (or evidence) to minimize your uncertainty (increase knowledge) regarding the Target Node. For this purpose, the Target Interpretation Tree algorithm uses the entropy (or binary entropy) of the Target Node as the metric to minimize. Lowering the entropy reduces the uncertainty regarding the state of the Target Node, i.e., the lower the entropy, the more we know.
- The Target Interpretation Tree is closely related to the Adaptive Questionnaire. The Adaptive Questionnaire is a dynamic tree for seeking evidence. It applies to one specific case given its observed evidence. The Target Interpretation Tree is a static tree that is induced from all cases. As such, it provides a more general approach in terms of searching for the optimum sequence of gathering evidence.
- Target Interpretation Trees are often generated in preparation for emergency situations, such as triage classification, in which rapid diagnosis with constrained resources is essential.
Usage
- The Target Interpretation Tree is available in Validation Mode.
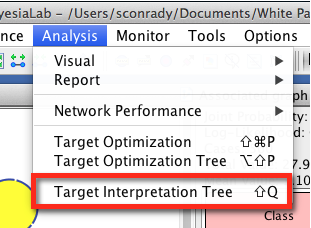
- It can be started via
Main Menu > Analysis > Visual > Target > Target Interpretation Tree.
Options
Upon starting the function, the option panel allows you to specify a number of parameters regarding the algorithm.

Center on State
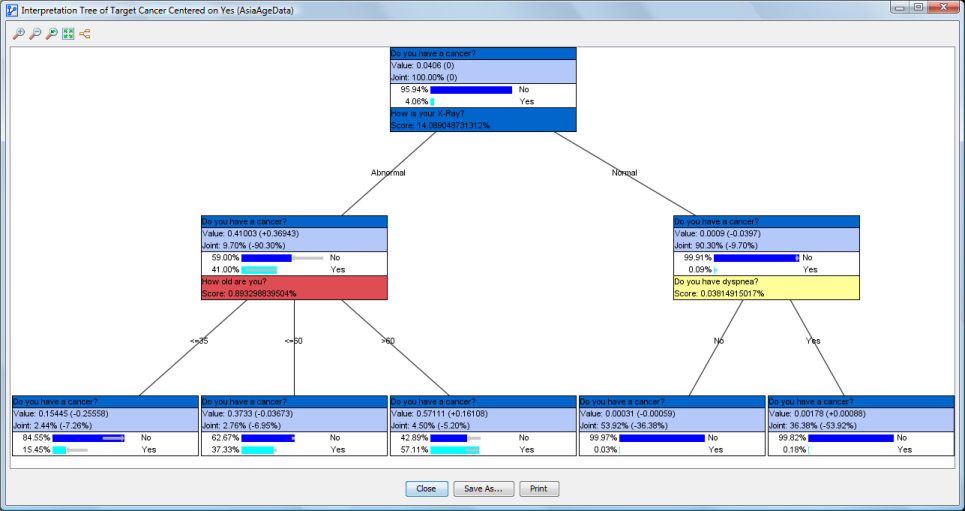
- By checking this option and selecting one state, BayesiaLab will highlight (in turquoise color) this particular state within each node in the subsequent tree diagrams.
Search Method
-
There are two ways in which BayesiaLab can compute each node’s Score while searching for the maximum entropy reduction of the Target Node.
- By setting Hard Evidence.
- By setting Value/Mean Variation, BayesiaLab will generate (continuous) mean values by “mixing” the discrete states of each node, thus setting Soft Evidence.
- Fix Means: at each observation, the probability distributions of the nodes are recomputed to generate the to-be-simulated mean values.
- Fix Probabilities: the probability distributions of the nodes are computed only once to generate the to-be-simulated mean values.
- Value/Mean Variation in % of Mean
- Value/Mean Variation in % of Variation
- Value/Mean Variation in % of Margin Progress
- The percentages of the negative and positive variations of each node mean can be edited with the Variation Editor.
-
The Utilize Evidence Cost option specifies that the Score will be computed as Mutual Information divided by Cost.
Search Stop Criteria
- The Search Stop Criteria limit the potential growth of the tree:
- You can specify the maximum number of nodes in a branch of the tree.
- The algorithm stops whenever the joint probability of a node’s state reaches the specified Minimum Joint Probability level.
- The Automatic Stop Criterion specifies the minimum value of the Score, i.e., the Conditional Mutual Information or the Conditional Mutual Information divided by the Cost. The algorithm stops if this value is lower than the given parameter.
Output
- Each branch of the tree will be saved as a line in the Evidence Scenario File.
- If an Evidence Scenario File already exists, you will be prompted to either replace it, or to append the examples at the end.
Results Display
Tree
-
The algorithm starts by identifying the node in the network with the highest Score. Score is defined by Mutual Information/Cost if Cost is utilized, otherwise the Score equals Mutual Information.
-
If Hard Evidence is utilized, the number of outgoing branches reflects the number of states of the node on which we are seeking the next evidence.
-
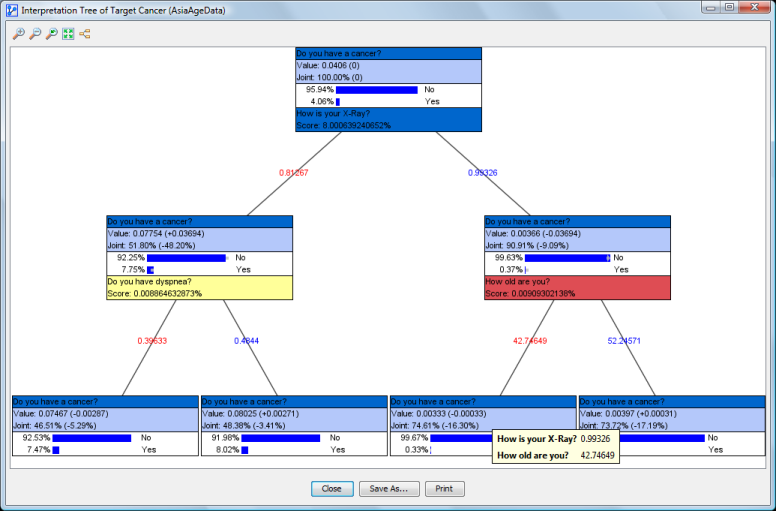
If Value/Mean Variation is used, two branches are displayed. They correspond to the positive and negative variations of the Value/Mean. This means that the results are displayed in the form of an n-ary tree if Hard Evidence is used. If Value/Mean Variation is selected, the resulting tree is binary. In the context of Hard Evidence, each branch is marked with the state’s name. For Value/Mean Variation, the respective values of the positive and negative variations are shown. The positive and negative variations are shown in blue and red, respectively.
-
For each branch, the search is repeated on the remaining nodes until one of the stop criteria applies or no further nodes can be observed.
-
Filtered States are not taken into account in the search.
Nodes
-
Each node in the tree is identified by the algorithm as the next best piece of evidence to observe. Intuitively, each node represents, in its particular context, the “next best question to ask.”
-
Nodes are quite similar to Monitors and contain four elements:
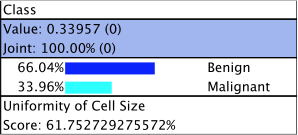
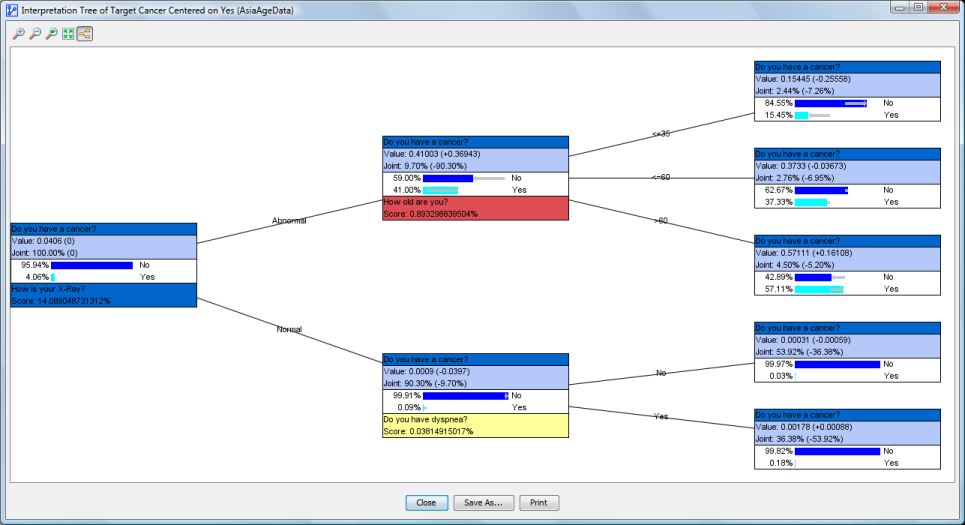
- The name (or comment) of the Target Node. The background has the same color as the Target Node in the network graph. Note that this top panel with the Target Node’s name (or comment) is the same for each node in the tree.
- In the section right underneath, the value of the node and its joint probability are shown. The values in parentheses indicate the changes versus the prior state, i.e., before setting the evidence indicated by the incoming branch.
- In the next section, we have the probability distribution of the Target Node after setting the evidence shown in the incoming branch, but before setting the next evidence, which is recommended at the bottom of the node. The probability of each state is shown in percent, just like in the Monitors. If the search is centered on a specific state (see Options), this state is highlighted in turquoise.
- Unless a node is a leaf (i.e., at the end of a branch), the name (or comment) of the next node to observe is shown at the bottom, along with its Score. The background is the same as the node’s color in the graph.
Toolbar
- The toolbar at the top of the window allows you to:
- to zoom in;
- to zoom out;
- to go back to the default zoom level;
- to fit the tree to the window;
- to display the tree horizontally.
Actions
-
The buttons at the bottom of the window allow you to close the window, save the tree as a graphic, or print it.
-
By right-clicking on the window’s background, you can bring up the Context Menu with the following options:
- Display Node Comments instead of Node Name.
- Display the states’ long names.
- Copy the tree as an image or in HTML format. HTML copy is ideally suited for pasting the tree into a spreadsheet. Both the vertical and horizontal trees can be reproduced. Node colors are also retained.
-
You can zoom into a specific part of the tree by selecting an area on the screen with your mouse pointer (click-and-hold). The shortcut
Ctrl+ mousewheel performs zooming in and out, centered on the cursor position. -
Moving the mouse over a node displays a tooltip containing the chain of evidence obtained thus far.
-
By double-clicking on a node, you can close its subtree. Double-clicking again returns the subtree.