Adaptive Questionnaire
Context
-
The Adaptive Questionnaire provides step-by-step guidance for finding the optimal evidence to reduce the uncertainty regarding a Target Node.
-
A typical application would be diagnosing a patient. In such a context, a clinician would want to seek the most relevant diagnostic steps for establishing the patient’s suspected condition instead of broadly performing generic tests.
-
The Adaptive Questionnaire helps prioritize what node to investigate or what pieces of evidence to collect in order to reduce the uncertainty regarding the Target Node.
-
Whenever you have a Bayesian network with a Target Node, regardless of whether the network was machine-learned or created from expert knowledge, you can launch the Adaptive Questionnaire.
-
Importantly, the Adaptive Questionnaire seeks the optimal sequencing of evidence for a specific case or instance, rather than creating a set of rules that apply in general.
-
For creating a generalized set of priorities, please see the Target Interpretation Tree.
Usage
-
To demonstrate the use of the Adaptive Questionnaire, we use the example from Chapter 6 in our e-book, which is about diagnosing breast cancer based on characteristics from a biopsy.
-
You can download the corresponding network file here: AugmentedMarkovBlanketSC05
-
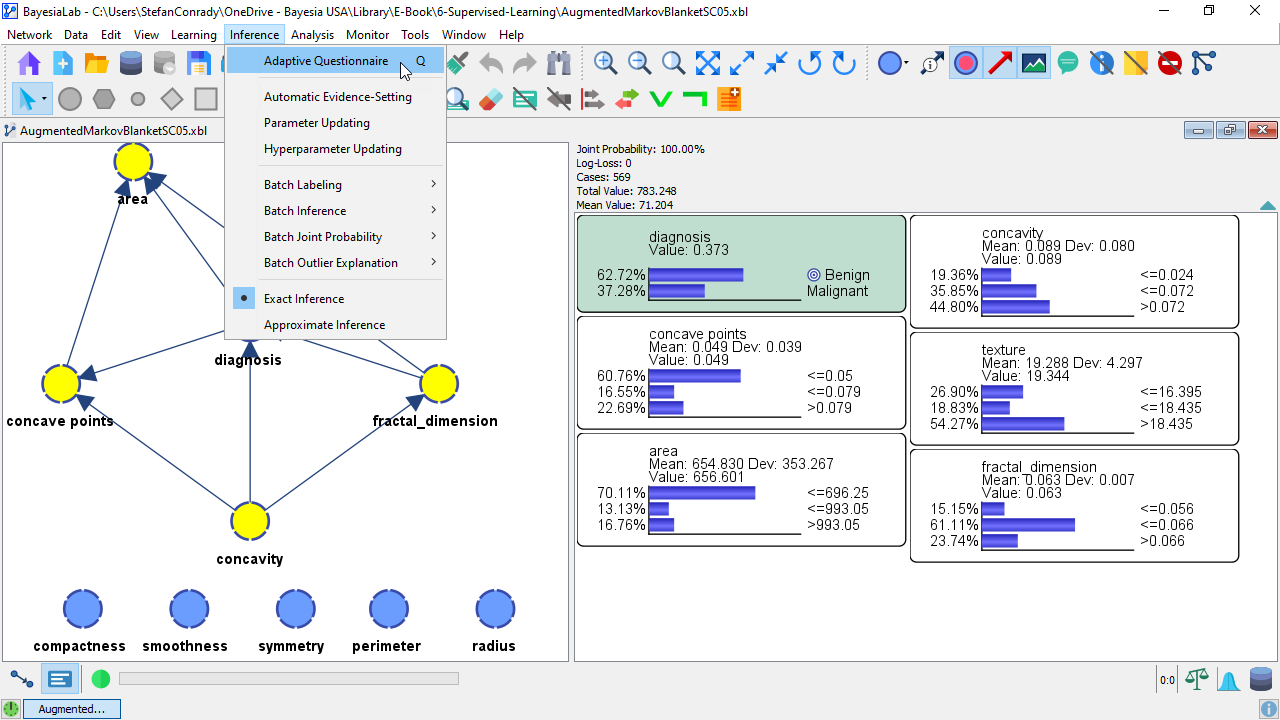
To start the Adaptive Questionnaire, select
Main Menu > Inference > Adaptive Questionnaire.

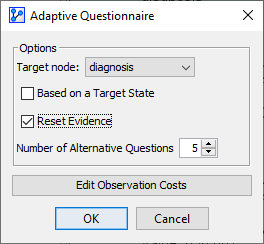
- For a Target Node with more than two states, it can be helpful to specify a Target State for the Adaptive Questionnaire.
- Setting a Target State allows BayesiaLab to compute the Binary Mutual Information and then focus on the designated Target State.
- However, as the Target Node in our example is binary by default, setting a Target State is superfluous.

Costs
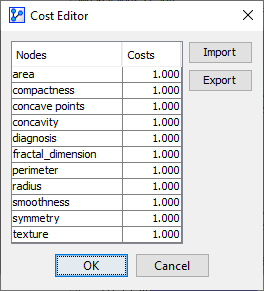
- Furthermore, we can set the cost of collecting observations via the Cost Editor, which can be started by clicking the Edit Observation Costs button.
- This is helpful if certain variables are more costly to observe or require more effort to obtain than others.
- Costs do not necessarily have to represent a financial cost. For instance, we could make Costs proportional to the difficulty of collecting observations.

In analyzing Fine Needle Aspirates, all image attributes are obtained simultaneously. As a result, this particular domain is not ideal for demonstrating the Adaptive Questionnaire.
A better example would be a diagnostic process, in which a clinician collects observations from a patient in a targeted way. We can imagine that a physician starts the diagnosis process by collecting easy-to-obtain data, such as blood pressure, before proceeding to more elaborate (and more expensive) diagnostic techniques, such as performing an MRI.
-
Now, we simulate the use of the Adaptive Questionnaire as if we were able to choose the order of collecting evidence.
-
After starting the Adaptive Questionnaire, BayesiaLab presents the Monitor of the Target Node and displays its marginal probability. That Monitor is highlighted in green.
-
Furthermore, the Monitors are automatically sorted in descending order with regard to the Target Node by taking into account the Mutual Information (or Binary Mutual Information, if applicable) and the Cost of obtaining the evidence:
Loading SVG... -
So, we obtain the order:
- concave points
- area
- concavity
- texture
- fractal_dimension
-
Given this order, it would be ideal to collect the value of concave points as the first observation.
-
Also, while the Adaptive Questionnaire is active, the Toolbar features two extra elements:

- Clicking the button removes all evidence and returns the Adaptive Questionnaire to its starting point.
- Clicking the button stops and closes the Adaptive Questionnaire.
Setting Observation #1
-
Let us suppose that we can do that and obtain concave points <= 0.079 as the first piece of evidence.
-
Upon setting that state in the Monitor of concave points, the Monitor Panel is updated as follows:
Loading SVG... -
In the Monitor of the Target Node, we see that the probability of diagnosis=malignant has increased to 69.08%.
-
The order of Monitors is resorted according to Mutual Information and Cost:
- fractal_dimension
- concavity
- area
- texture
-
The Monitor of the node we just observed drops to the bottom of the list. Given that we already know its value, no further information can be gained from it.
-
Also, the distributions of all the not-yet-observed nodes have changed, with concavity increasing substantially.
-
The small gray arrows inside the Monitors indicate how much the probabilities have changed.
-
Note that we are not merely seeing the next-in-line Monitor “moving up”. Rather, the entire list is recomputed given the most recent piece of evidence.
-
For instance, when we started the Adaptive Questionnaire, area was two spots ahead of texture. Given the last observation, however, texture has become more important than area.
Observation #2
-
So, from the above ordering, texture would be the next best evidence to obtain.
-
In real-world applications, it is possible, though, that the ideal evidence is not available and therefore must be skipped. We simulate such a situation by observing area instead of texture.
-
We find area<=696.25 and enter that evidence in the corresponding Monitor:
Loading SVG... -
The probability of diagnosis=malignant decreases to 56.23%.
-
The order of the remaining unobserved nodes is now:
- texture
- concavity
- fractal_dimension
Observation #3
-
For this iteration, we follow the top recommendation, i.e., texture, and observe texture<=16.395.
Loading SVG... -
The probability of diagnosis=malignant decreases further to 15.70%.
-
The order of the remaining unobserved nodes is now:
- concavity
- fractal_dimension
Observation #4
-
For this iteration, we follow the recommendation, i.e., texture, and observe concavity>0.072.
Loading SVG... -
The probability of diagnosis=malignant increases to 19.04%.
-
At this point, only fractal_dimension remains unobserved.
Observation #5
-
For the last node, fractal_dimension, we obtain fractal_dimension <= 0.056.
Loading SVG... -
In this hypothetical example, the last observation appears to have a rather substantial impact on the diagnosis.
-
The Monitor of the Target Node now reports that diagnosis=malignant has a probability of 93.05%.
Summary & Next Steps
- The Adaptive Questionnaire is a highly practical tool for seeking the optimal next piece of evidence when trying to determine the state of a Target Node.
- In this example, we used the Adaptive Questionnaire via the Graphical User Interface in BayesiaLab.
- For situations when end-users do not have access to the BayesiaLab software, you can publish an Adaptive Questionnaire via the WebSimulator. This allows anyone to interact with an Adaptive Questionnaire through a web browser.
- Finally, BayesiaLab offers a separate tool that can produce a kind of “static” version of the Adaptive Questionnaire, which can be used entirely offline. This tool is the Target Interpretation Tree, which is available under
Main Menu > Analysis > Visual > Target > Interpretation Tree.
