Occurrences Report
Context, Background, and Motivation
-
Occurrences refer to the number of observations in a cell of a Probability Table or a Conditional Probability Table.
-
The number of cells in a Conditional Probability Table, is a function of the following parameters:
- The number of Parent Nodes.
- The number of Node States of the Parent Nodes.
- The number of Node States of the Child Nodes.
-
The following example with one Parent Node (Age, measured in years) and one Child Node (BMI, i.e., Body Mass Index, measured in kg/m2) illustrates this with numbers:
-
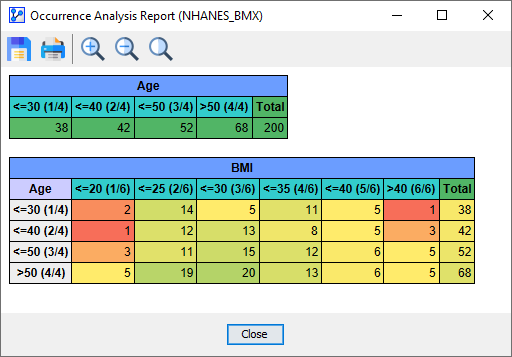
Here, Age is discretized into 4 states and BMI into 6 for a total of 48 cells in the table associated with BMI.
-
The numbers in each cell are counts of observations or Occurrences. In our case here, each Occurrence represents one person from the sample of 200 individuals.
-
For instance, the Occurrence table associated with BMI states that Count(BMI≤20 | Age≤30)=2. So, we have only two Occurrences of that particular condition, i.e., only two individuals who are 30 years old or younger have a BMI of 20 or lower.
-
To create a Bayesian network, BayesiaLab needs to translate the Occurrences in each cell into probabilities.
-
However, with a small number of Occurrences, that can become an issue.
-
We have repeatedly referenced a rule of thumb, which says that we should have a minimum of 5 Occurrences per cell to estimate a Probability Table or Conditional Probability Table reliably.
-
In our example, we have several cells that fall below the recommended minimum.
-
In a small example, such deficiences are easy to recognize, but in more complex networks, it can be difficult to spot such weaknesses.
-
That is the motivation for the Occurrence Report. It displays all tables in a network, and visually highlights potentially problematic cells, in which Occurrences are low.
Usage
-
Select the nodes you want to include in the Occurrences Report. I none are selected, the analysis will be performed on all nodes.
-
To create the Occurrences Report, select
Menu > Network > Reports > Occurrences. -
The Occurrence Report opens up and shows all Probility Tables and Conditional Probability Tables.

-
The fields in the report are color-coded to highlight potential issues:
- Cells with 0 Occurrences are marked in red.
- Cells with 5 Occurrences are marked in yellow. This is generally considered the minimum number of Occurrences.
- Cells with 40 or more Occurrences are marked in green.
-
Furthermore, the Occurrence Report calculates the mean number of Occurrences for each row in all Probability Tables and Conditional Probability Tables.
-
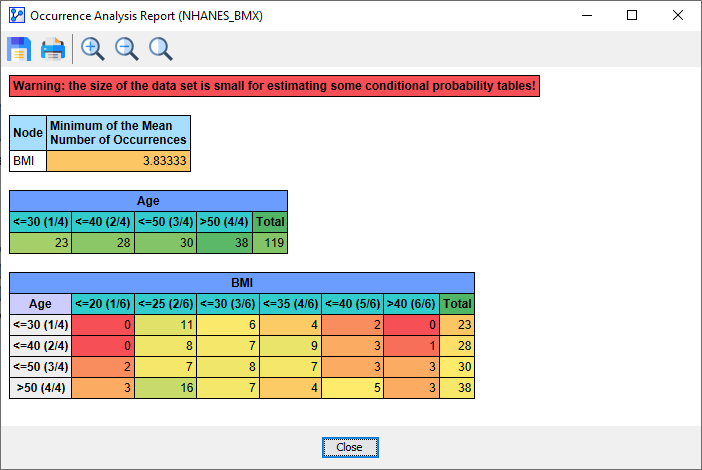
If the mean value of any row in any of the nodes drops below the threshold of 5, the corresponding nodes are called out at the top of the report.
-
Additionally, the affected nodes in the Graph Panel are marked with the information icon .
-
If the mean value of any row in any of the nodes drops below the threshold of 4, an additional warning message appears at the top of the report.

-
At this point, at the latest, you should review the Discretization (for Continuous variables) and Aggregation (for Discrete variables).
-
After arbitrarily reducing the number of states to three for both nodes — just for demostration purposes, we see that the Occurrences Report now seems much less problematic.


