Step 2 — Definition of Variable Types
Context
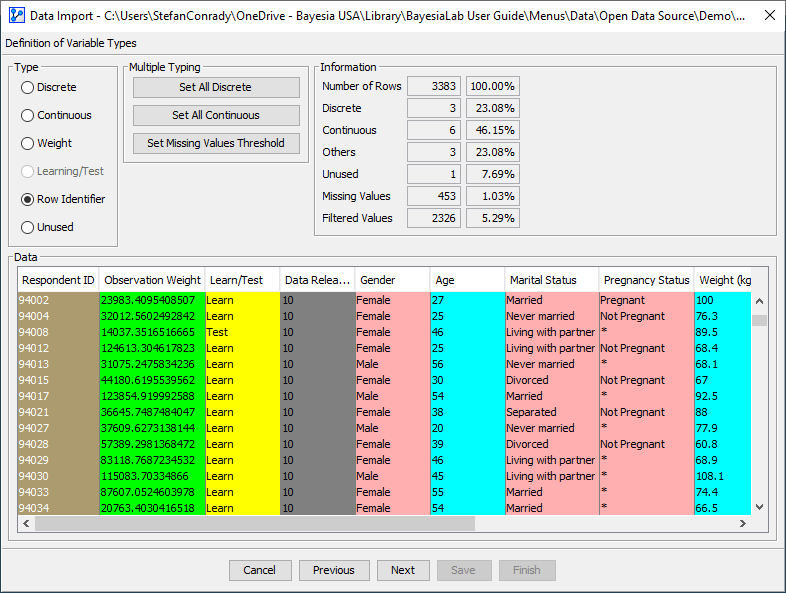
- In Step 2 — Definition of Variable Types of the five-step Data Import Wizard, you define variable types.
- Step 2 contains four related panels with linked actions.
Overview of Elements in Step 2
Type
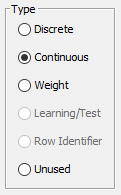
- Use the radio buttons in the Type panel to define the type of each variable.
- Before you start making determinations, BayesiaLab has already made some guesses regarding the appropriate variable type, i.e., Discrete versus Continuous.
- Furthermore, some variables have limited options regarding the variable type because of their distributions:
- If a variable has the same value for all observations, it falls into the Unused variable type. Such a not-distributed variable cannot be imported into BayesiaLab.
- Variables that contain any text values cannot be declared Continuous variables.
- Variables with Missing Values cannot be of the type Weight, Row Identifier, or Learn/Test.
Usage
- To select a variable, click the variable header or click anywhere inside the column in the Data panel.
- You can select multiple variables using keyboard shortcuts common in spreadsheet editing:
Ctrl+Click: add a variable to the current selection.Shift+Click: add all variables between the currently selected and the clicked variable to the selection.Ctrl+A: select all variables in the Data panel.Shift+End: select all variables from the currently selected variable to the rightmost variable in the table.Shift+Home: select all variables from the currently selected variable to the leftmost variable in the table.
- The current selection is highlighted by showing the selected columns in a darker shade of their current color.
Loading SVG...
Discrete
- The Discrete type considers each unique value of the variable a distinct state.
- Any variable that contains text will be considered Discrete by default.
- The maximum number of unique values that can be accommodated can be specified under
Main Menu > Window > Preferences > Editing > Node > Maximum Number of States.
Continuous
- The Continuous type applies to numerical variables, which must be discretized in Step 4 — Discretization and Aggregation.
- If a variable contains integer values above a certain threshold, the variable will be considered Continuous.
- You can specify this threshold under
Main Menu > Window > Preferences > Data > Import & Associate > Threshold for Assuming Integers as Continuous. The default threshold value is 5.
Learn more about Discrete and Continuous nodes in the Node Editor topic.
Weight
- Weighting is often applied to surveys to make a survey sample representative of the demographics of the underlying population.
- If your dataset contains such a Weight variable, select it by clicking on the corresponding column.
- Then, select the Weight button in the Type panel.
- Later, in Step 4 — Discretization and Aggregation, you can specify whether or not to normalize the Weight variable.
Learning/Test
- For a dataset that has already been split into a Learning Set and a Test Set, you can use such an existing definition to import your data into BayesiaLab.
- Both the Learning Set and the Test Set need to be in the same data table, rather than in separate files.
- A binary indicator variable needs to identify each set with a unique code.
- With a Learning/Test variable defined, in Step 4 — Discretization and Aggregation of the Data Import Wizard, you need to assign which of your codes corresponds to BayesiaLab’s Learning and Test states.
Row Identifier
- You can assign one or more variables to serve as Row Identifiers. The values of Row Identifiers are imported but not processed in any way. They serve as labels that are attached to each record.
- There are numerous functions in BayesiaLab that allow you to look up what record in the dataset corresponds to what is currently on display on the screen.
- For instance, Automatic Evidence-Setting displays the Row Identifier in the Status Bar.

Unused
- By selecting the
Unusedbutton, you can skip the import of the selected variables. In previous versions of BayesiaLab, this option was also known as “Not Distributed.” - Unused is automatically applied to variables containing only a single value across all observations, i.e., when the variable is “not distributed,” hence the original name.
- Unused variables will appear grayed out in the remaining steps of the Data Import Wizard.
Multiple Typing
- The Multiple Typing panel allows you to quickly assign variable types across multiple variables.
- Click
Set All to Discreteto apply the Discrete type to all variables, if possible. - Click
Set All to Continuousto apply the Continuous type to all variables, if possible.
By clicking either button, all previous type assignments are replaced.
You can automatically remove variables, i.e., set them to the Unused type, if they exceed a certain percentage of Missing Values in a column.
- Click the
Set Missing Values Thresholdbutton. - In the pop-up window, set the percentage.
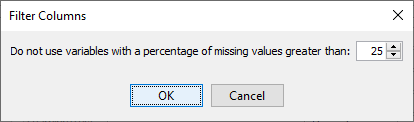
- All variables that exceed the specified threshold are set to Unused.
Information
The Information panel provides statistics related to the current type assignments:
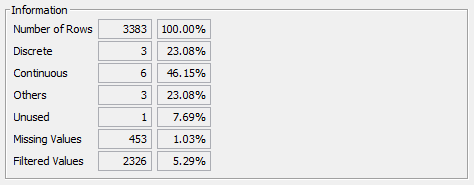
Number of Rowsrefers to the number of records in the dataset to be imported. In the context of datasets, rows, records, cases, samples, and observations all have equivalent meanings.Discreteshows the absolute count of variables currently assigned to the Discrete type. The percentage refers to the proportion of Discrete variables among all variables, including the type Unused.Continuousshows the absolute count of variables currently assigned to the Continuous type. The percentage refers to the proportion of Continuous variables among all variables, including the type Unused.Othersdisplays the count of all the variables assigned to the types Row Identifier, Weight, or Learn/Test.Unusedshows the absolute count of variables currently assigned to the Unused type. The percentage refers to the proportion of Unused variables among all variables.Missing Valuesdisplays the count of cells in the dataset that contain Missing Values. The percentage refers to the proportion of cells in the dataset that contain Missing Values, including all variable types, even Unused, Row Identifier, and Learning/Test.Filtered Valuesdisplays the count of cells in the dataset that contain Filtered Values, as indicated by the asterisk (*). The percentage refers to the proportion of cells in the dataset that contain Filtered Values, including all variable types, even Unused, Row Identifier, and Learning/Test.
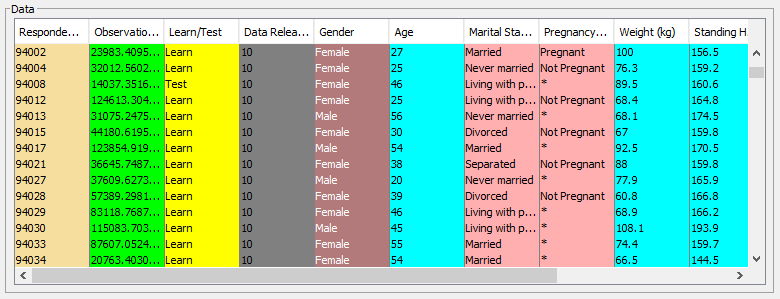
Data
- The Data panel visualizes the current variable selection and type assignment with colors (see Usage above).
- Horizontal and vertical scrolling allows you to view the entire dataset that will be imported.