Automatic Evidence-Setting
Context
- Automatic Evidence-Setting is a function that takes single observations from a dataset or sets of evidence from an Evidence Scenario File and performs inference with the current Bayesian network.
- So, with Automatic Evidence-Setting, you can inspect — record-by-record — how each individual set of observations/evidence relates to the values inferred through the Bayesian network.
- If the Bayesian network features a Target Node, Automatic Evidence-Setting compares the inferred values to the observed states.
- In earlier versions of BayesiaLab, Automatic Evidence-Setting was known as Interactive Inference.
Usage
- To start Automatic Evidence-Setting, select
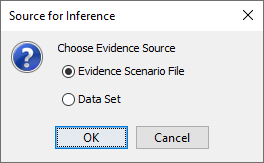
Main Menu > Inference > Automatic Evidence-Setting. - If both an Evidence Scenario File and an associated dataset are available for inference, BayesiaLab prompts you to choose your source:
- Once Automatic Evidence-Setting is activated, an additional control panel appears in the Toolbar.

-
This control panel allows you to scroll through the associated dataset or Evidence Scenario File, depending on what you selected.
-
Clicking the button takes you back to the first record, i.e., record 0 in the dataset or scenario 0.
-
The button selects the previous record/scenario.
-
The counter box shows the record/scenario number of the currently displayed set of evidence.
-
The button selects the next record in the dataset/scenario.
-
Clicking takes you to the last record in the dataset/scenario.
-
Click the button to include Not-Observable Nodes for inference, even though they are normally excluded.
-
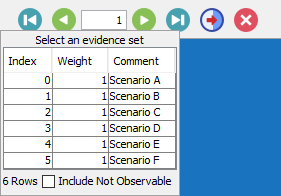
If you are using an Evidence Scenario File for inference, you can select a specific scenario by right-clicking on the counter box in the control panel. A dropdown list shows all available scenarios in the Evidence Scenario File.
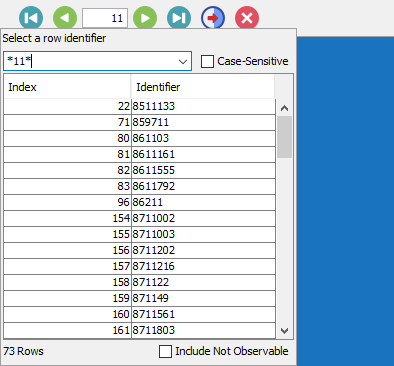
- If you are using a dataset that contains a Row Identifier, you can search for a specific record by right-clicking on the counter box in the control panel and entering a search string. You can also use wildcards, i.e.,
?to represent a single character and*for any number of characters. Upon pressingEnter, you obtain a list of results, from which you can select a specific record for inference.
-
If you scroll through the records associated with a predictive Bayesian network model featuring a Target Node, you can compare the observed states of the Target Node with the states inferred or predicted by the model.
-
For instance, the following Monitors show the observed states for all predictor nodes (highlighted in green) plus the corresponding inferred distribution of the Target Node diagnosis.
-
Here, the inferred probabilities are approximately 75% for Malignant and 25% for Benign. The bar highlighted in silver indicates the actual observation in this particular case, i.e., the ground truth, which is that the sample was indeed Malignant.
Loading SVG... -
Going through records this way, comparing prediction vs. actual states one by one, can help you develop intuition for the sometimes abstract performance measures generated through Network Performance Analysis.
-
Clicking exits the Automatic Evidence-Setting mode.
-