Neighborhood Analysis
Work in Progress
We’re actively working on this section.
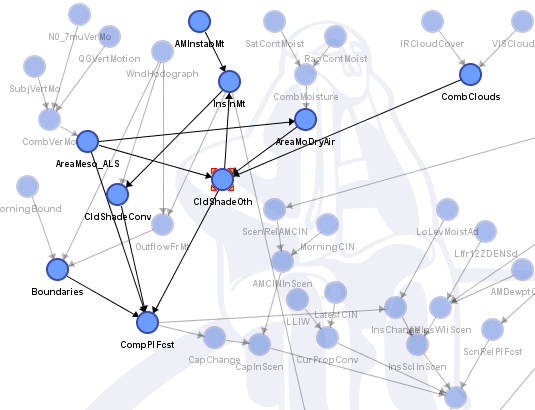
This analysis allows you to visualize, for the selected nodes, the set of nodes that belong to them based on the mode chosen in the toolbar:
The nodes that do not belong to the selected node are made translucent and are no longer selectable. When you click a visible node, nodes that do not belong to it become translucent. To make all nodes visible again, click anywhere except a visible node.
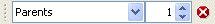
Use the combo box to display:
- Markov Blanket
- Spouses
- Parents. You can specify how far ancestors are displayed with the corresponding field.
- Children. You can specify the distance at which descendants are displayed with the corresponding field.
- Neighbors. You can specify the distance at which neighbors are displayed with the corresponding field.
The number of displayed nodes appears in the Graph Window status bar.
In the following example, the Markov blanket of the selected node is displayed, i.e., the unrelated nodes are made translucent: