Target Optimization Tree
Context
-
The Target Optimization Tree algorithm searches for values to be set on nodes in a given network to optimize the Target Node.
-
It looks for the optimal sets of evidence that bring us closer to achieving the specified objective.
-
In this context, two optimization options are available:
- The algorithm can optimize the probability of the Target State of the Target Node.
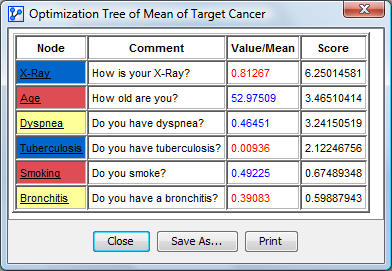
- Alternatively, it can optimize the mean value (expected value) of the Target Node.
-
The Target Optimization Tree is similar to the Target Dynamic Profile optimization except that instead of producing only the single best set of evidence, i.e., the optimal policy, it also explores alternative evidence sets.
Usage & Workflow
- In Validation Mode
F5, selectMain Menu > Analysis > Target Optimization > Target Optimization Tree. - Then, you can specify the search options for your optimization task.
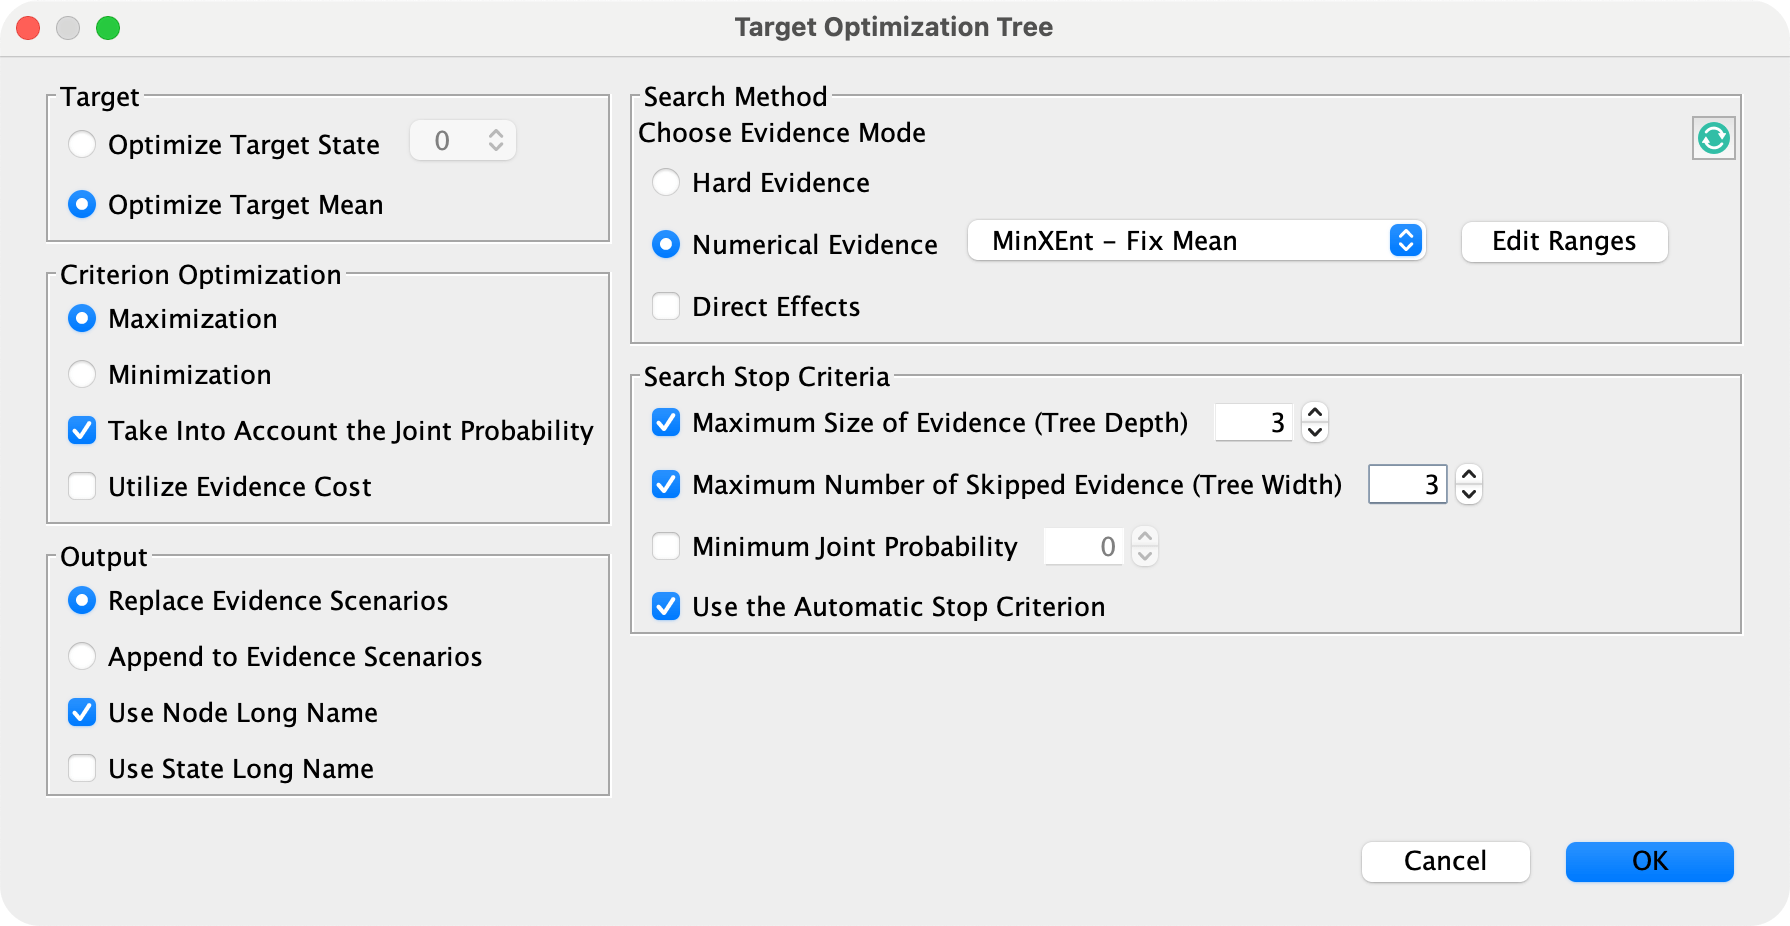
Target
- You must specify the Target Node. By default, the current Target Node in the network is selected.
- You must choose to optimize either the Target State or the mean value (expected value) of the Target Node.
Optimization Criterion
- You can choose to maximize or minimize the criterion.
- A checkbox specifies whether to take into account the joint probability of the evidence in the search. In this case, we will optimize the a posteriori probability, i.e., the probability of the target state given the evidence, weighted by the occurrence probability of that evidence.
- In the same way, the cost of evidence can be taken into account.
- The observation context is also taken into account during the analysis.
Search Method
- Several search methods are available:
- By Hard Evidence on the states of the nodes.
- By observation of the value or mean of the nodes. The observation can be done either by fixing means, i.e., the convergence algorithm will find, at each new observation, a probability distribution to obtain the desired mean, or by fixing the probabilities, i.e., at startup, the probability distributions corresponding to the desired means are computed once and will not change further.
- The observed means will vary in percentage:
- Of the initial means of the nodes
- Of the variation domains of the nodes
- Of the margin progress of the nodes, i.e. the difference between the initial mean and the minimum of the domain and the difference between the initial mean and the maximum of the domain.
- The percentages of the negative and positive variations of each node can be modified with the mean variation editor.
- The observed means will vary in percentage:
Search Stop Criteria
- The settings panel allows you to constrain the search using four stop criteria, which can be used individually or in combination.
- You can specify the maximum number of nodes that can be observed in any branch of the tree.
- You can also specify the maximum number of alternate trees to be generated. Alternate trees correspond to the nodes that are skipped in the right branches of the tree.
- The algorithm can also stop if the accumulated evidence falls below the specified minimum joint probability.
- The automatic stop criterion is a heuristic test that allows us to find a good balance between the optimization due to an evidence and the impact on the joint probability.
Output
- The results will be saved as an Evidence Scenario.
- Each branch of the tree corresponds to a row in the Evidence Scenario File.
- If an Evidence Scenario File is already associated with the network, you can choose to replace it or to append the newly-generated optimized scenarios to the end of the file.
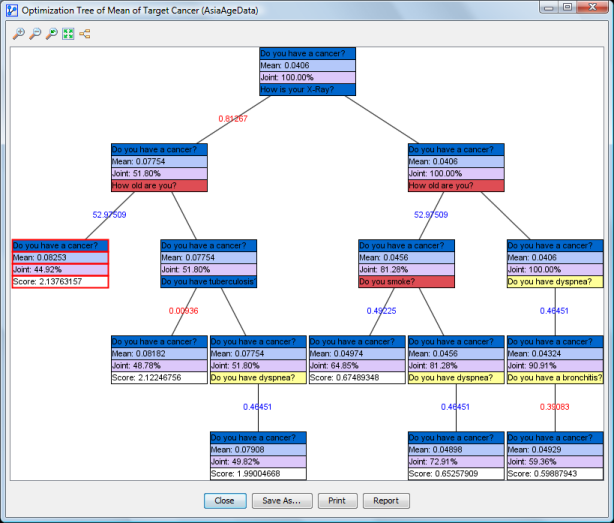
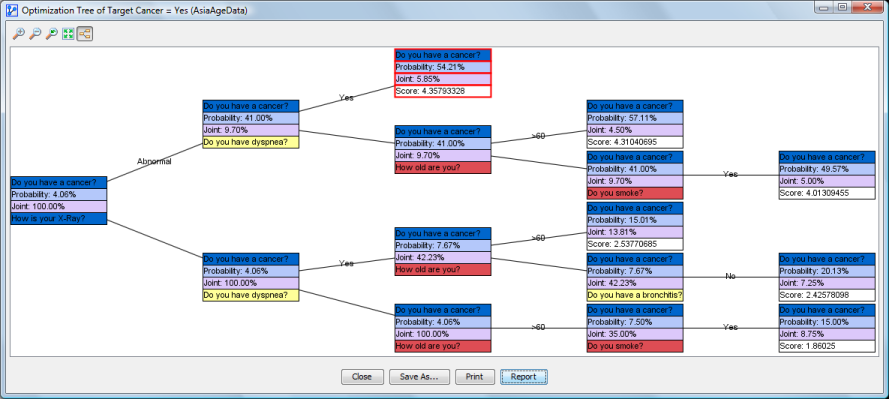
Target Optimization Results
-
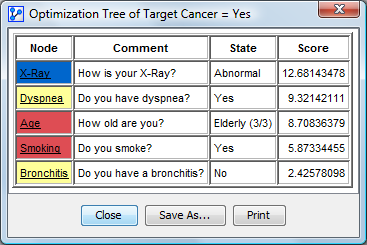
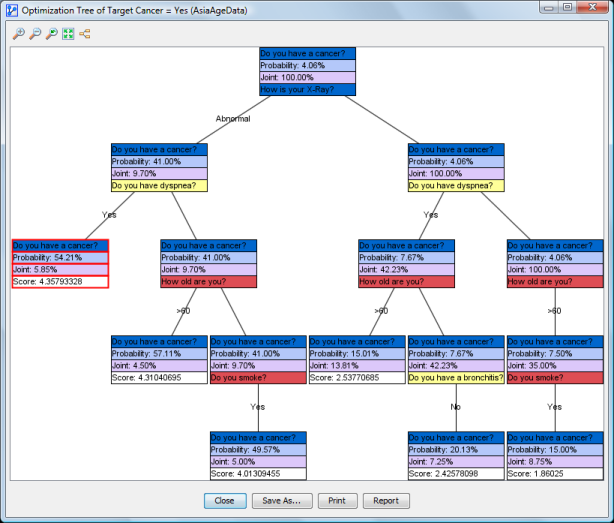
The algorithm finds the best value (or evidence) to set on a node for optimizing the target, i.e., the probability of the state or the node’s mean value.
-
Once the optimal value of this node is found, the algorithm creates two branches in the tree underneath that node:
- The left branch features the node on which the evidence is set, and that evidence remains in place for the entire subtree below that node.
- If Hard Evidence is set, the name of the observed state is displayed on the branch.
- If a mean value is set, it is displayed as such.
- If the mean value is smaller than the prior mean value of the node, it is shown in red.
- If the mean value is greater than the prior mean value of the node, it is shown in blue.
- In the right branch, called an alternate tree, no value is set on the node, i.e., it remains unobserved. Furthermore, this node remains unobserved in the subtree that continues below.
- The left branch features the node on which the evidence is set, and that evidence remains in place for the entire subtree below that node.
-
For each branch, the search is repeated for all remaining nodes using the same rules until:
- One of the stop criteria is reached;
- There are no further nodes that can be observed.
-
Filtered states are not taken into account in the search.
-
Each box in the tree contains four elements:
-
The name or comment of the Target Node. The background color matches the node’s color.
-
The probability of the Target State of the Target Node before setting the evidence (if we optimize the target state) or the mean of the target node before setting the evidence (if we optimize the mean).
-
The Joint Probability before setting the evidence.
-
If the node is not a leaf, the name or comment of the chosen node that will be observed.
-
If the node in the network has a color, the background of the node in the tree will feature the same color. Otherwise, it shows the value of the optimization score with a white background.
-
The final node of the optimal, leftmost branch is highlighted by a red border.
-
Toolbar
- Using the toolbar at the top of the window, you can:
- zoom in;
- zoom out;
- go back to the default zoom level;
- fit the tree to the window;
- display the tree horizontally.
Actions
-
With buttons at the bottom of the window, you can:
- Save an image of the tree;
- Print the tree;
- Display a report.
-
From the Context Menu, you can:
- Display the Node Comment instead of Node Names;
- Display the Long Names of the Node States;
- Copy the tree as an image or in HTML format.
- If you select
Copy as HTML, the output file will feature a vertical and a horizontal tree. The HTML formatting also reflects the colors featured on the tree.
- If you select
-
You can manually zoom in by clicking and dragging your cursor to select the area of interest.
-
The shortcut
Ctrl/Cmd+ mousewheel zooms in and out centered on the cursor. -
Moving your cursor over a node displays a Tooltip featuring the “chain of evidence” from the top node down to the node under the cursor.
-
Double-clicking on a node closes its corresponding subtrees.
-
Double-clicking that node again reveals the subtree again.
Report
- Depending on the options specified, clicking the
Reportbutton produces a report listing the optimal nodes in the tree and their optimal observations plus the corresponding optimization scores.