Data Ratio
Context
-
The Structure/Data Ratio is one of the measures that can be computed in the Structural Coefficient Analysis and plotted in the Curve window.
-
When plotted, the Structure/Data Ratio can help you determine an appropriate value for the Structural Coefficient given your dataset and the learning algorithm you selected.
-
The Structure/Data Ratio (Learning Samples) is intended to be used primarily in the context of Unsupervised Learning.
-
In the context of this ratio, “Structure” refers to the complexity of the network, and “Data” refers to the fit of the data to the network.
-
More formally, the Structure/Data Ratio is defined as
where:
- DL(B) refers to the Description Length of the Bayesian network, representing the complexity of the structure.
- DL(D|B) refers to the Description Length of the data given the Bayesian network. This is a measure of fit.
Usage
- To illustrate the Structure/Data Ratio measure, we use the following sample network, which is based on a small extract from the 2017 National Health and Nutrition Examination Survey .
-
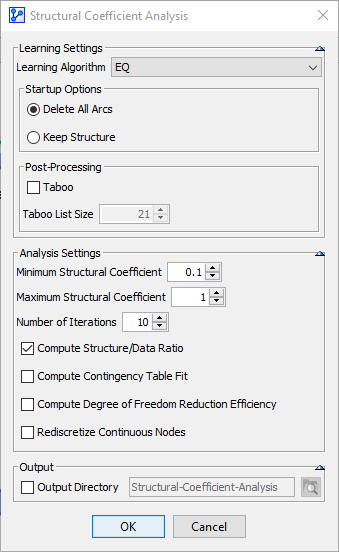
On this network, we perform a Structural Coefficient Analysis:
Main Menu > Tools > Multi-Run > Structural Coefficient Analysis. -
We follow the overall workflow introduced in Structural Coefficient Analysis.
-
Given that the Structure/Data Ratio is particularly relevant in the context of Unsupervised Learning, we use EQ as the Learning Algorithm and set a Structural Coefficient range from 0.1 to 1.
-
Upon clicking the Curve button at the bottom of the report, we obtain the following plot.
-
In the screenshot below, we have 10 x-y pairs shown on the plot:
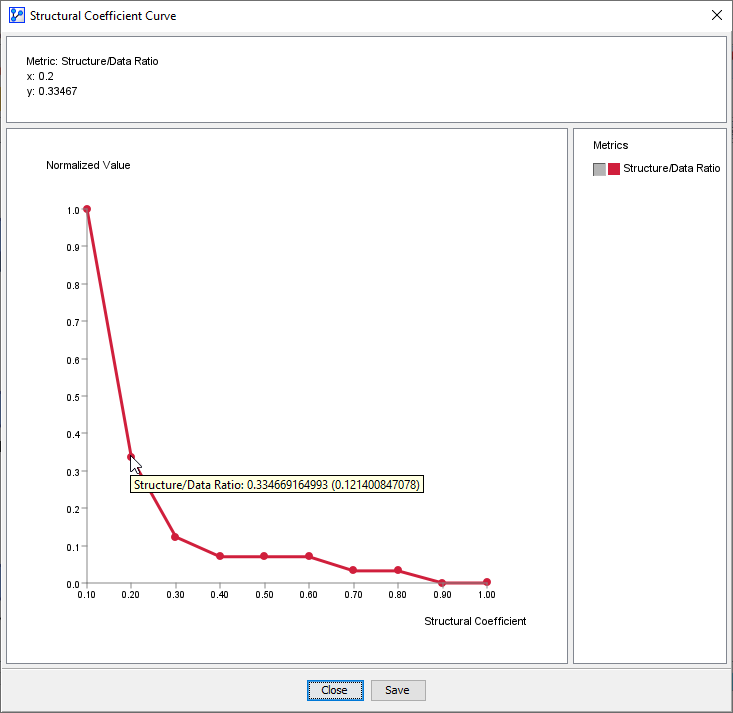
-
The x-axis represents the Structural Coefficient values.
-
The y-axis shows the Structure/Data Ratio computed for each network learned with the corresponding value of the Structural Coefficient.
-
Note that the y-values are normalized to a 0 to 1 range, i.e., the smallest computed Structure/Data Ratio is displayed as 0 and the largest value as 1.
-
Hovering over a point shows the normalized value plus the unnormalized value in parentheses.
Interpretation
- To interpret this graph, we need to read it from right to left. In this example, moving along the x-axis from 1 to 0.4, the curve remains fairly flat. This suggests that decreasing the Structural Coefficient keeps the ratio nearly constant. In other words, fit and complexity remain within their respective order of magnitude.
- As we continue further to the left along the x-axis, i.e., , we observe an inflection of the curve. This tells us that the value of the numerator increases more rapidly than the denominator, meaning we gain more in complexity than in terms of fit.
- For , the curve accelerates rapidly upwards, implying that the complexity increases significantly.
- This would be a typical sign of overfitting. You generally want to avoid Structural Coefficient values in that portion of the curve.
- As a rule of thumb, a Structural Coefficient value at the inflection point of the curve (or “elbow”) or higher may represent a reasonable value.