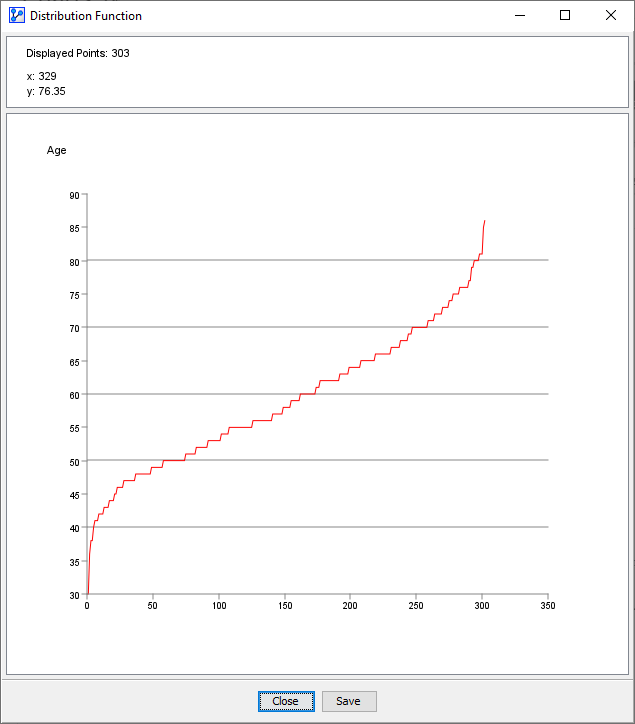
Distribution Function
Context
The Distribution Function chart shows the Cumulative Distribution Function (CDF) of the selected variable.
Usage
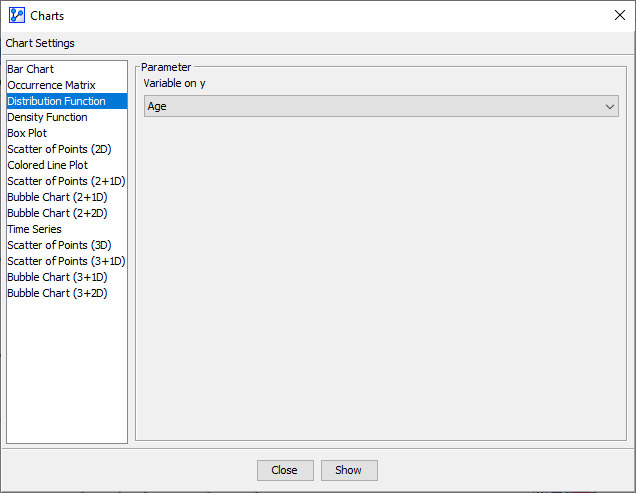
- You can access the Distribution Function in multiple ways:
Main Menu > Data > Charts > Distribution Function.Node Context Menu > Charts > Distribution Function.
- In the Parameter panel, select the variable to plot from the Variable on y dropdown menu.
- If you had nodes selected when you opened the Charts window, the variables in the dropdown menu are restricted to that selection.
- Click
Show.
- On the x-axis, the observations are ordered according to the corresponding y-values, from smallest to largest. The highest x-value corresponds to the total number of observations.
- On the y-axis, the values of the variable are plotted.
- The horizontal lines on the chart mark the thresholds of the node’s intervals. Note that these thresholds are for reference only and cannot be modified here.
- At the top of the chart window, the Information Panel reports the total number of plotted points plus the x and y coordinates of the cursor position.
- To zoom in to the chart, click and hold the left mouse button. Drag the cursor to designate the area to focus on. Then, release the mouse button.
- To revert to the default zoom level, double-click anywhere on the plot.