Car Evaluation: An Analysis of User Feedback


In today’s data-driven world, understanding customer feedback is crucial for product development and improvement. Traditionally, BayesiaLab employs machine learning techniques such as Probabilistic Structural Equation Models (PSEM) for Driver’s analysis, which relies on structured data to uncover relationships between variables.
However, in this case study, we extend the scope to analyze unstructured textual user feedback, uncovering insights into car performance evaluations.
This study highlights how Hellixia, BayesiaLab’s Subject Matter Assistant, can transform raw textual feedback into actionable insights through semantic mapping and causal modeling.
We examine two main datasets:
- A narrative synthesis summarizing the evaluations of 50 users.
- A dataset of 50 individual user feedbacks, each offering unique perspectives on the car’s performance.
While the domain of the feedback is consistent across both sections, it is important to note that the evaluations pertain to different car models. As such, we do not expect the outputs to align perfectly, offering an opportunity to compare and contrast the drivers of satisfaction for each model.
In both analyses, we will employ Hellixia’s Dimension Elicitor to identify key dimensions mentioned by users.
We then apply the Independence of Causal Influence (ICI) approach to model the causal effects of these dimensions on the car’s overall liking.
Finally, we assess each direct effect using a brainstorming-like method, powered by multiple Large Language Models (LLMs), including OpenAI’s GPT-o1, Anthropic’s Claude, Google’s Gemini, Mistral AI, and Meta’s LLaMA.
In the final section, we extend the analysis to sentiment exploration, using Hellixia’s semantic mapping to extract and model the emotional dimensions expressed in user feedback. This sentiment analysis uncovers how emotions—such as satisfaction, frustration, or excitement—directly shape overall customer perceptions and satisfaction.
The analyses and findings presented in this article are based on simulated data and are intended for illustrative purposes on how to utilize Hellixia and related methodologies for textual data analysis.
Analysis of Aggregated User Feedback
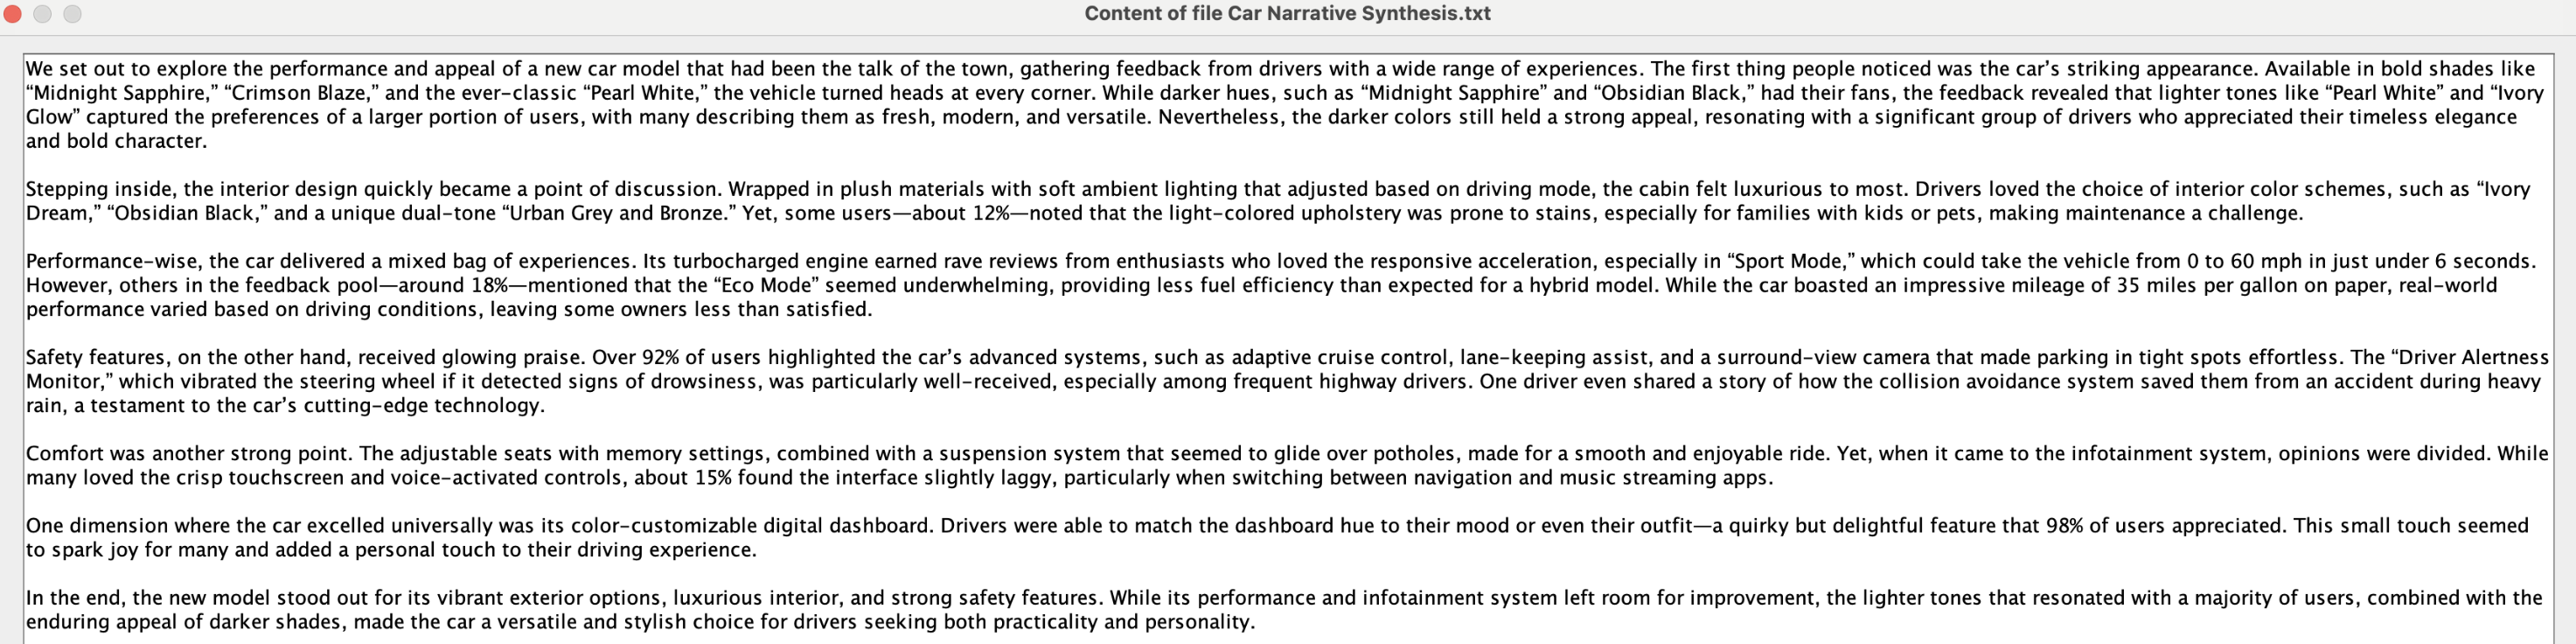
You will find below the content of the file Car Narrative Synthesis.txt that we’ll analyze:
We set out to explore the performance and appeal of a new car model that had been the talk of the town, gathering feedback from drivers with a wide range of experiences. The first thing people noticed was the car’s striking appearance. Available in bold shades like “Midnight Sapphire,” “Crimson Blaze,” and the ever-classic “Pearl White,” the vehicle turned heads at every corner. While darker hues, such as “Midnight Sapphire” and “Obsidian Black,” had their fans, the feedback revealed that lighter tones like “Pearl White” and “Ivory Glow” captured the preferences of a larger portion of users, with many describing them as fresh, modern, and versatile. Nevertheless, the darker colors still held a strong appeal, resonating with a significant group of drivers who appreciated their timeless elegance and bold character.
Stepping inside, the interior design quickly became a point of discussion. Wrapped in plush materials with soft ambient lighting that adjusted based on driving mode, the cabin felt luxurious to most. Drivers loved the choice of interior color schemes, such as “Ivory Dream,” “Obsidian Black,” and a unique dual-tone “Urban Grey and Bronze.” Yet, some users—about 12%—noted that the light-colored upholstery was prone to stains, especially for families with kids or pets, making maintenance a challenge.
Performance-wise, the car delivered a mixed bag of experiences. Its turbocharged engine earned rave reviews from enthusiasts who loved the responsive acceleration, especially in “Sport Mode,” which could take the vehicle from 0 to 60 mph in just under 6 seconds. However, others in the feedback pool—around 18%—mentioned that the “Eco Mode” seemed underwhelming, providing less fuel efficiency than expected for a hybrid model. While the car boasted an impressive mileage of 35 miles per gallon on paper, real-world performance varied based on driving conditions, leaving some owners less than satisfied.
Safety features, on the other hand, received glowing praise. Over 92% of users highlighted the car’s advanced systems, such as adaptive cruise control, lane-keeping assist, and a surround-view camera that made parking in tight spots effortless. The “Driver Alertness Monitor,” which vibrated the steering wheel if it detected signs of drowsiness, was particularly well-received, especially among frequent highway drivers. One driver even shared a story of how the collision avoidance system saved them from an accident during heavy rain, a testament to the car’s cutting-edge technology.
Comfort was another strong point. The adjustable seats with memory settings, combined with a suspension system that seemed to glide over potholes, made for a smooth and enjoyable ride. Yet, when it came to the infotainment system, opinions were divided. While many loved the crisp touchscreen and voice-activated controls, about 15% found the interface slightly laggy, particularly when switching between navigation and music streaming apps.
One dimension where the car excelled universally was its color-customizable digital dashboard. Drivers were able to match the dashboard hue to their mood or even their outfit—a quirky but delightful feature that 98% of users appreciated. This small touch seemed to spark joy for many and added a personal touch to their driving experience.
In the end, the new model stood out for its vibrant exterior options, luxurious interior, and strong safety features. While its performance and infotainment system left room for improvement, the lighter tones that resonated with a majority of users, combined with the enduring appeal of darker shades, made the car a versatile and stylish choice for drivers seeking both practicality and personality.
Extracting Key Dimensions with Hellixia’s Keyword-Based Semantic Mapper
To analyze the Narrative Synthesis effectively, we utilize Hellixia’s Document Analysis > Keyword-Based Semantic Mapper feature.
This tool allows us to extract the essential dimensions from unstructured text by leveraging advanced language models and semantic mapping techniques.

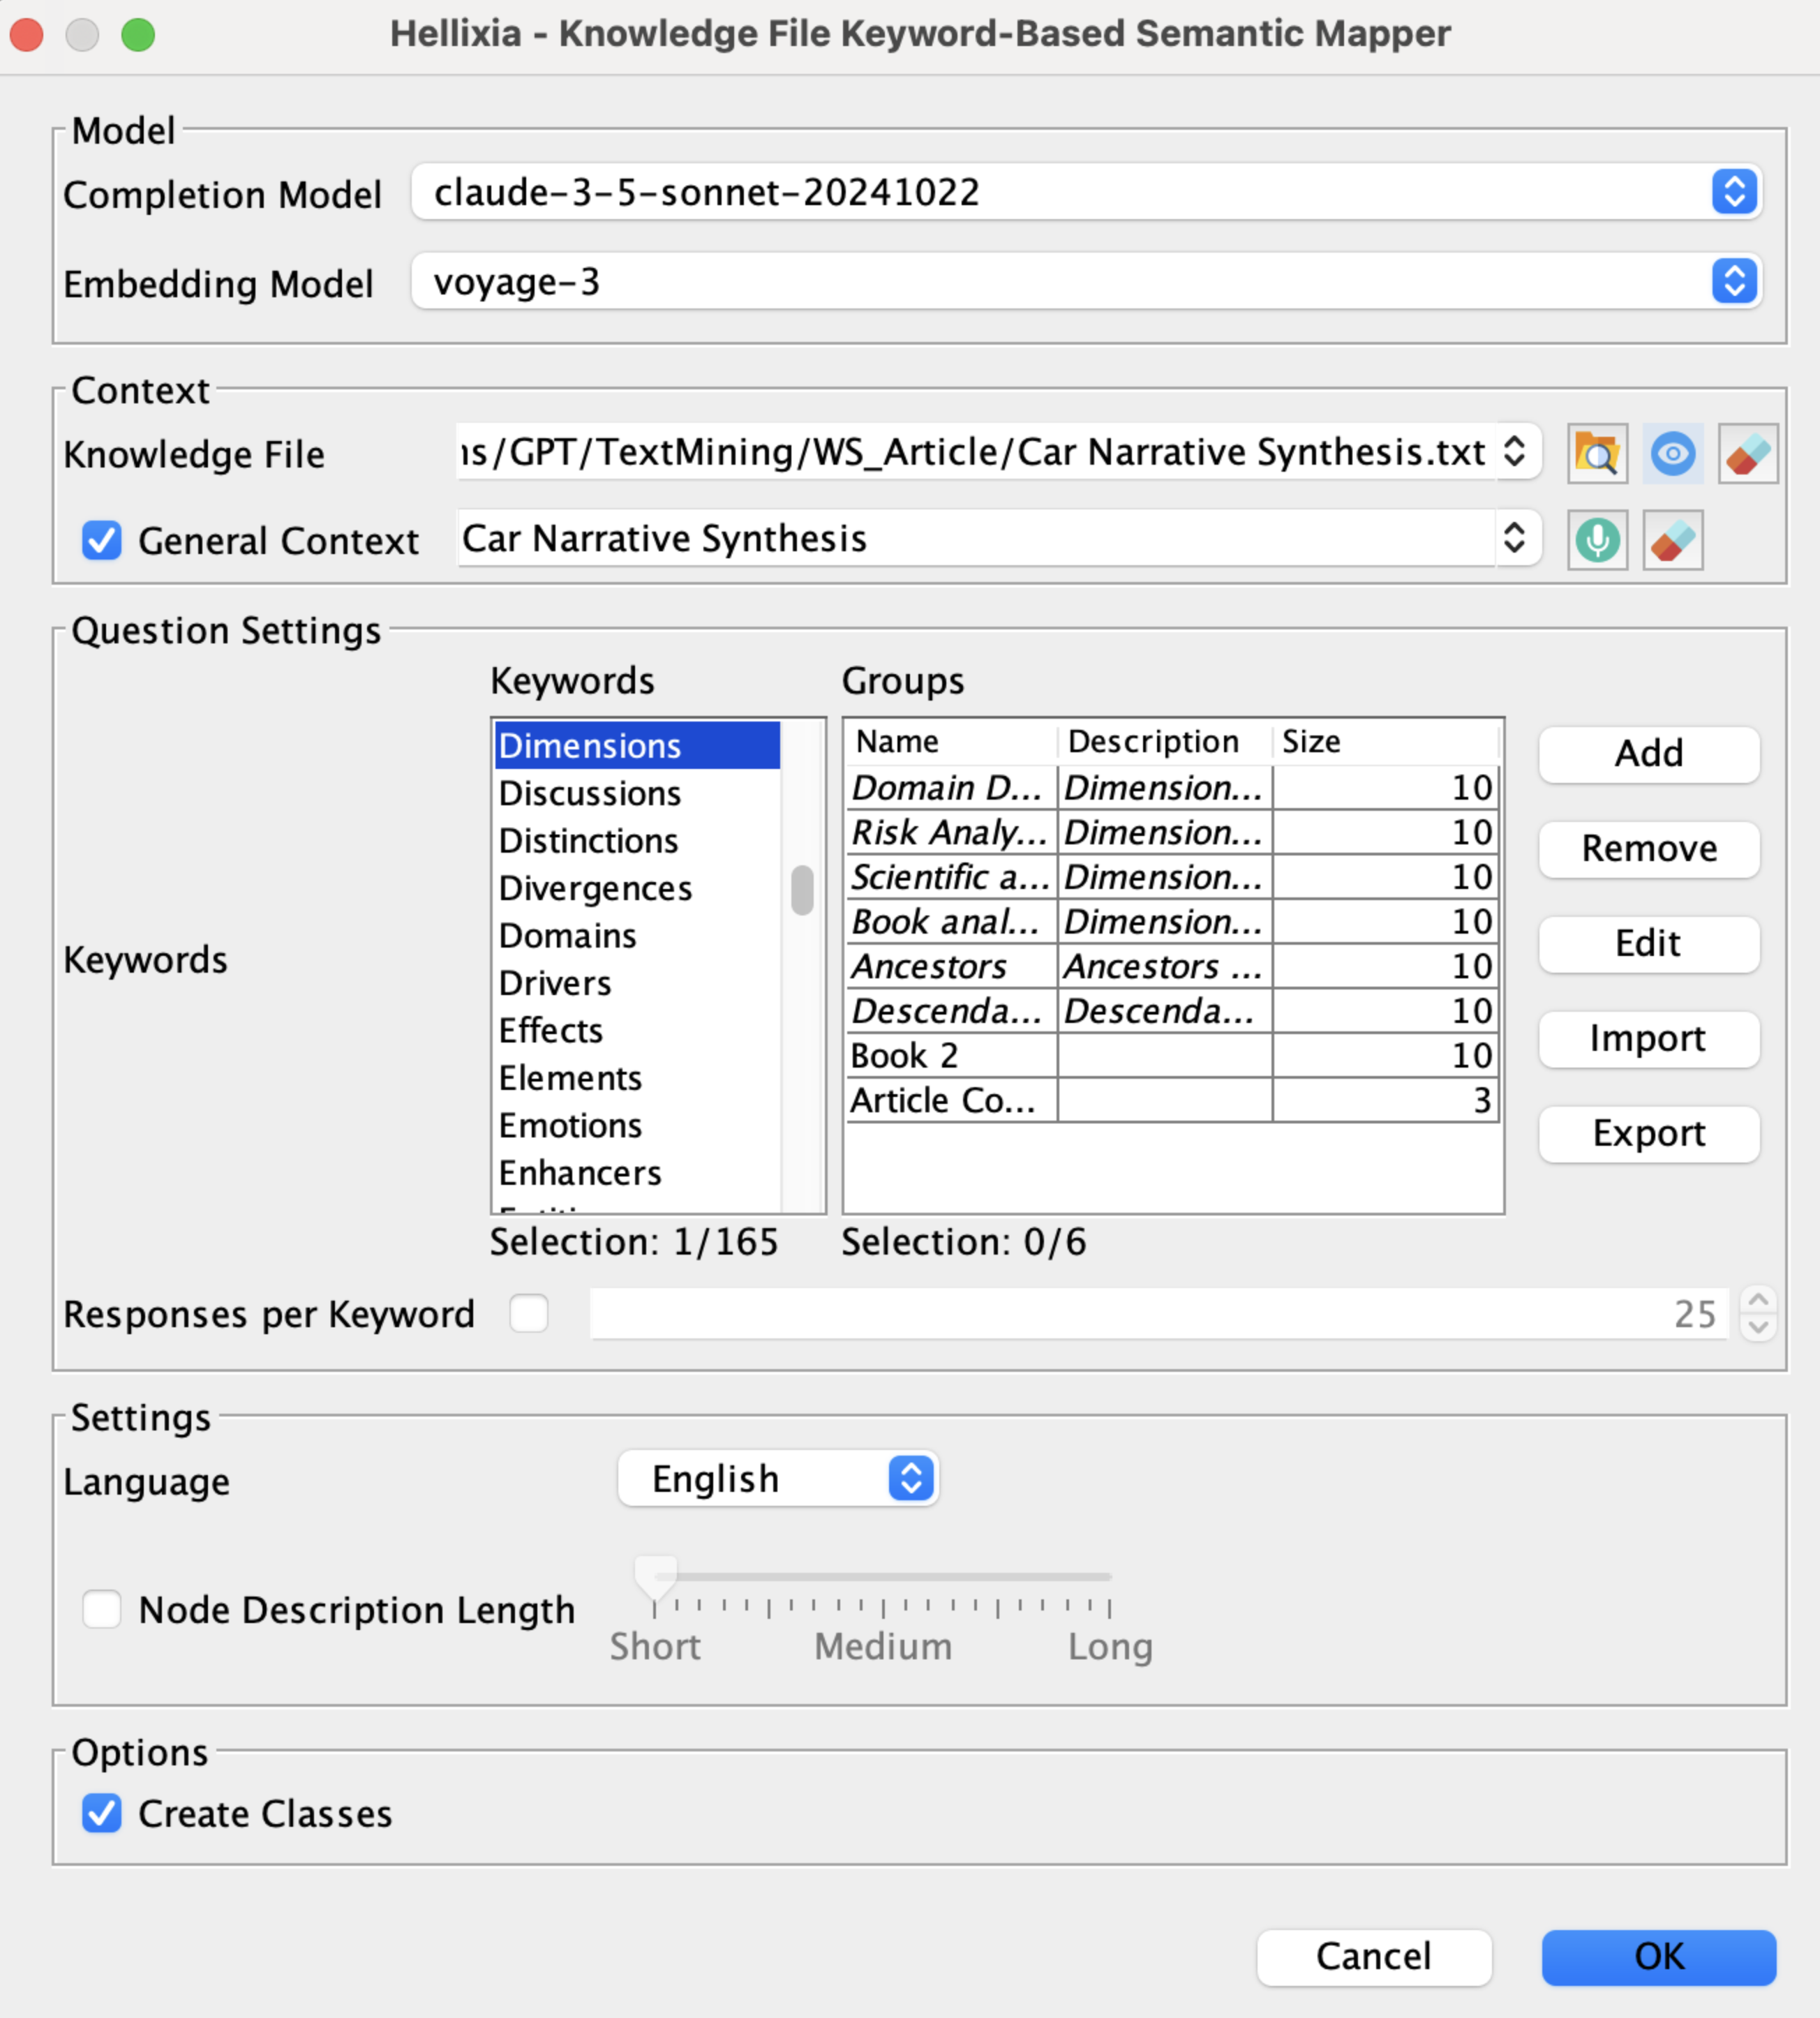
We first select the models:
- Completion Model (Claude Sonnet): Chosen for its advanced natural language understanding, ideal for analyzing nuanced narratives.
- Embedding Model (Voyage-3): Selected for its ability to effectively capture semantic relationships, crucial for creating an accurate semantic network.
Then, we define the context:
- Knowledge File: We load the file containing the narrative synthesis.
- General Context: Set to Car Narrative Synthesis to guide the model toward automotive-related themes.
We then select, among the 165 available keywords, “Dimension”. This choice directs the model to focus on extracting key aspects or features relevant to the car’s evaluation, such as performance, comfort, or safety features.
By clicking on the “Show” icon , we access a preview of the text file. This feature allows us to verify the content before proceeding with the analysis.

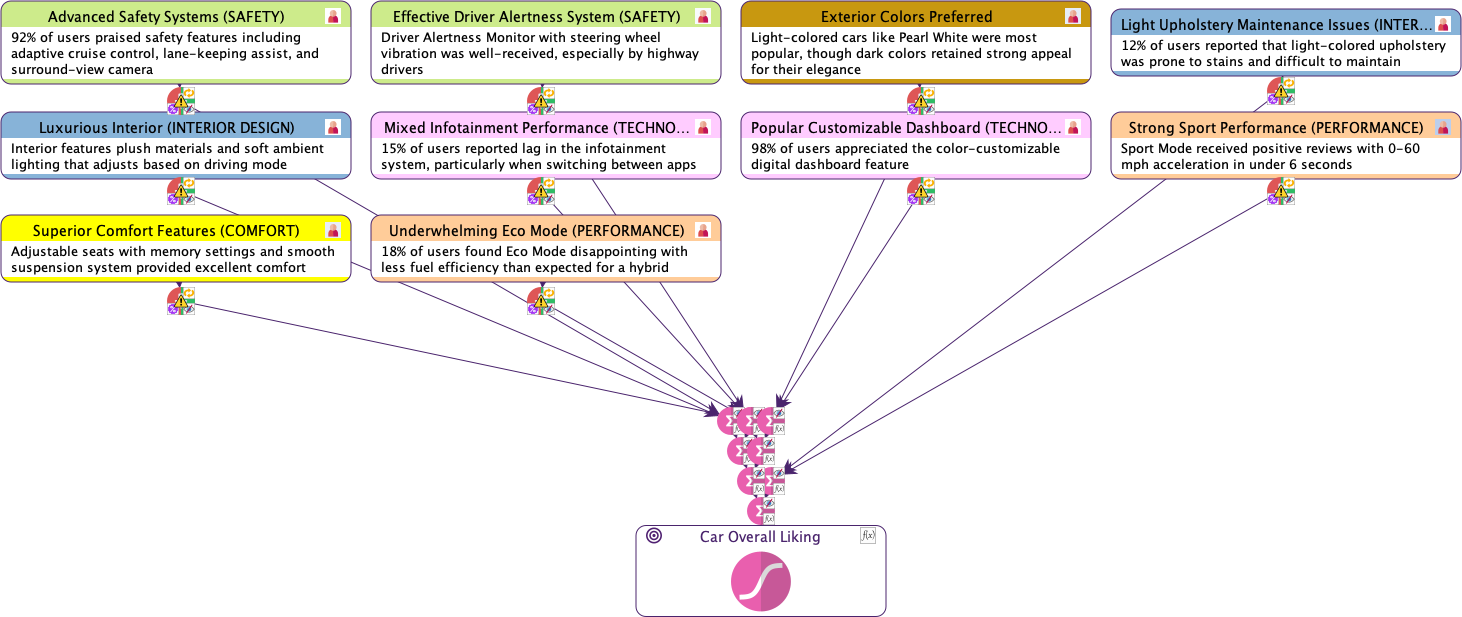
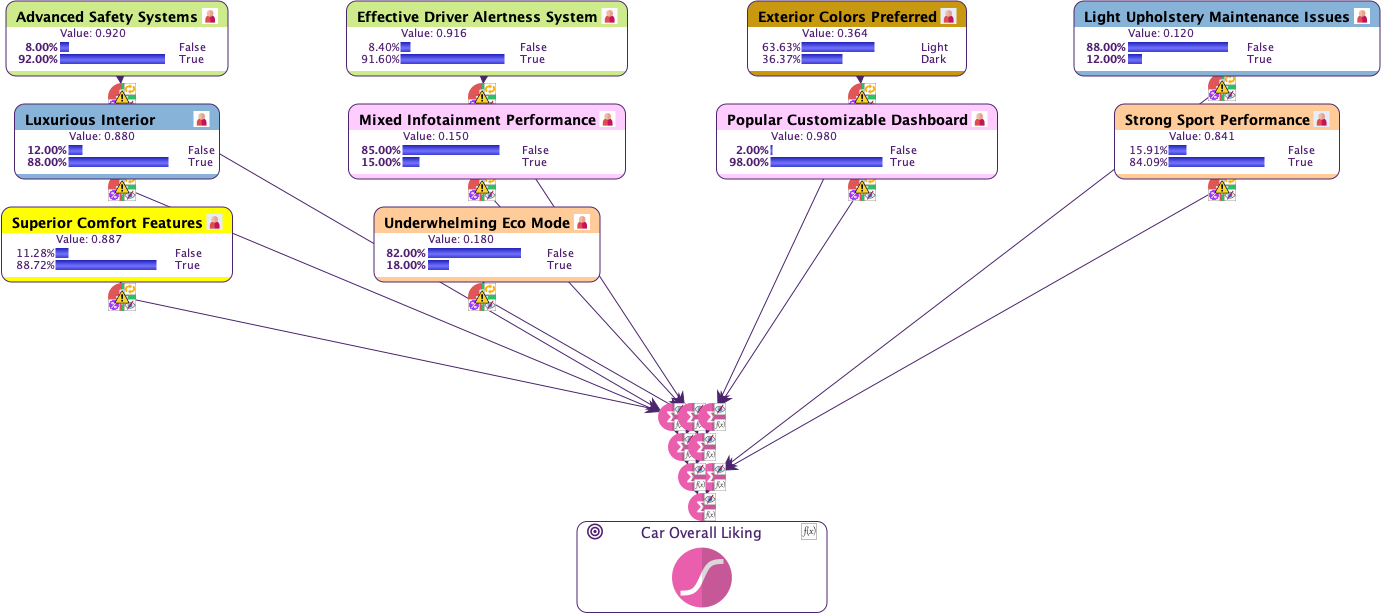
Upon validation, we obtain a semantic network that visually represents all the extracted dimensions:
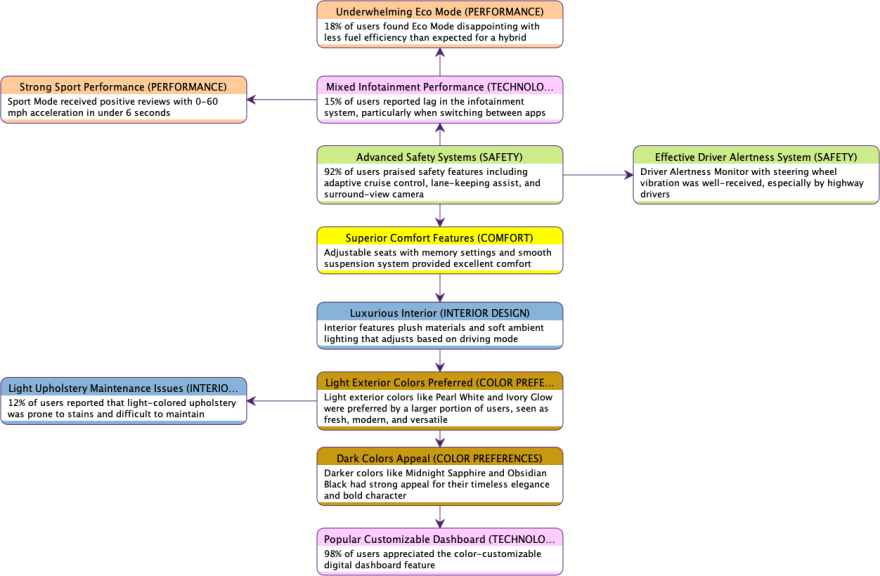

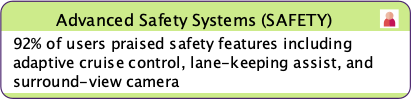
Each node represents a dimension extracted from the text, accompanied by a comment that provides context or elaboration. For example, dimensions such as Superior Confort Features, Advanced Safety Systems, and Luxurious Interior are identified, each highlighting specific user sentiments or observations.
The connections between nodes are based on the generated embeddings. These embeddings are numerical representations that capture the semantic relationships between dimensions, enabling the network to reflect how concepts are related in the context of the narrative. The links are purely semantic relationships, illustrating how closely related different dimensions are based on their contextual meanings.
While the semantic network may display directed links between nodes, it’s crucial to understand that the directionality of these links is not indicative of causal relationships but purely associational.
By leveraging embeddings, the semantic network not only identifies key dimensions but also shows the proximity of ideas, indicating which aspects users often discuss together or perceive as related.
With the essential dimensions extracted and visualized, we can now proceed to model their causal effects on the car’s overall liking using the Independence of Causal Influence (ICI) approach. This will allow us to understand how each dimension influences user satisfaction and identify areas for improvement or emphasis.
Modeling Causal Effects with the Independence of Causal Influence (ICI) Approach
Currently, the nodes are continuous and have been discretized into five bins of equal frequency based on the embeddings to facilitate the learning of the semantic network. For the next phase, we will:
- Delete all existing arcs.
- Select all nodes.
- Convert the nodes to True/False using
Tools > Boolean Conversion.
Among the 11 dimensions extracted from the narrative, we can see that Dark Colors Appeal and Light Exterior Colors Preferred represent the same underlying factor.
We delete both original nodes and create a new node Exterior Colors Preferred with two states: Light and Dark.
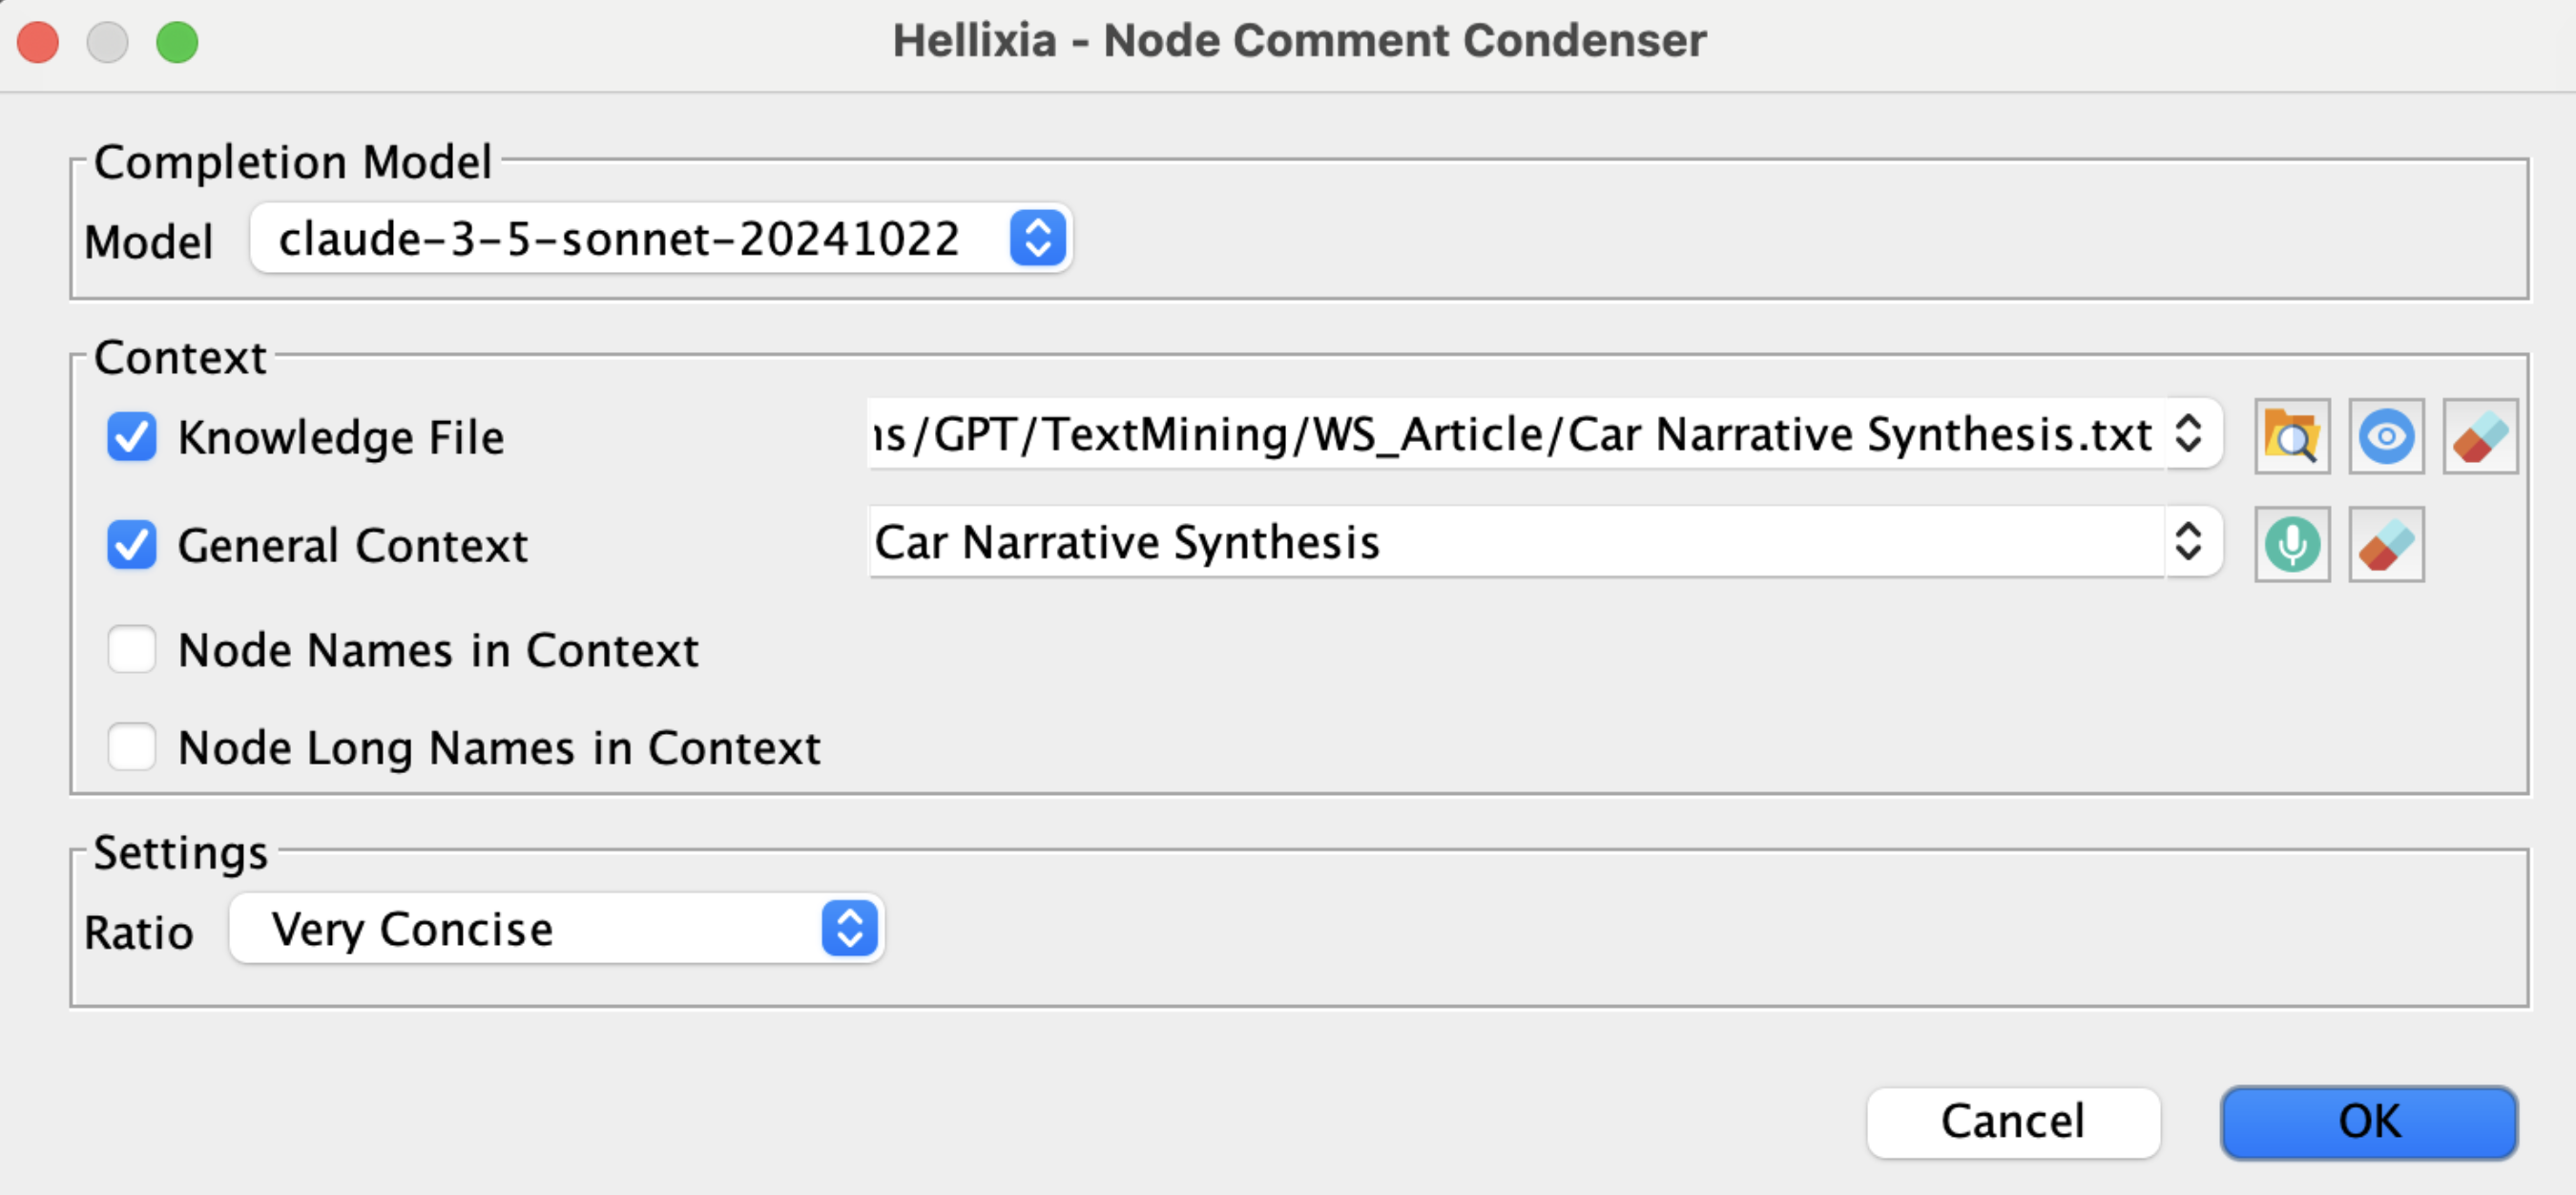
To document this new node, we first use Hellixia > Comments > Definition-Based Comment Generator.

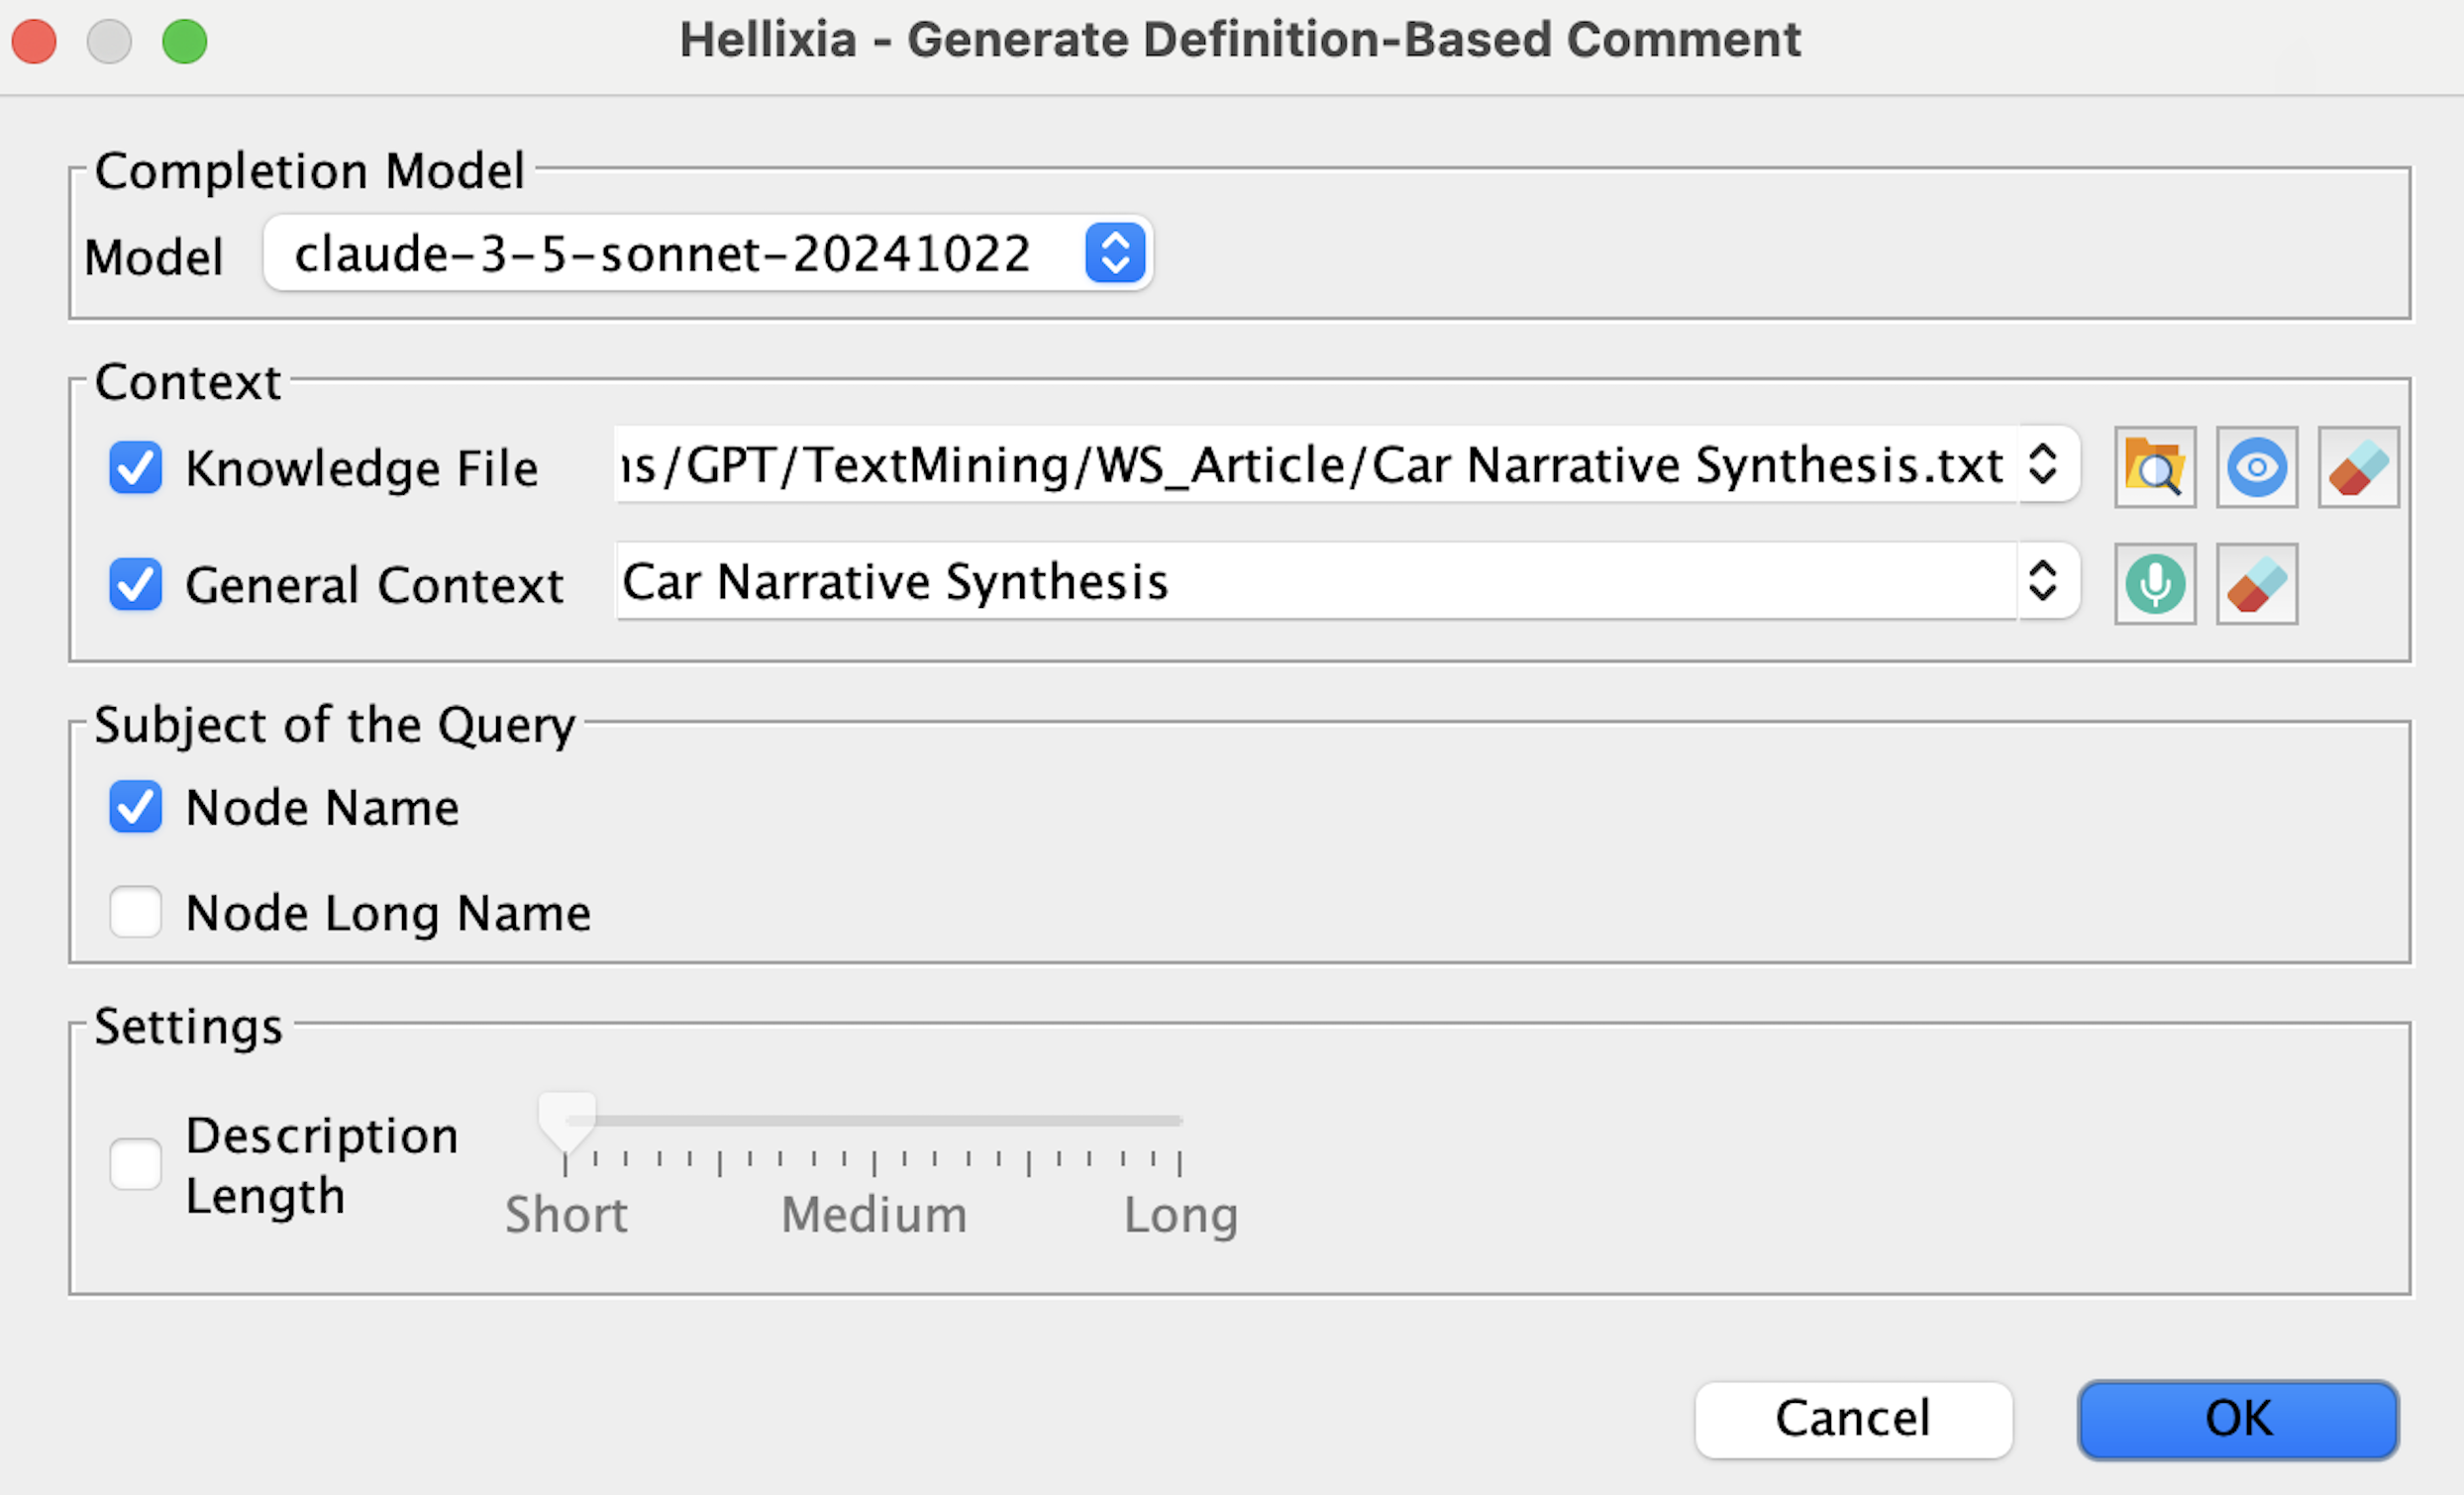

We then simplify the resulting description using Hellixia > Comments > Node Comment Condenser for conciseness.


After completing these steps, we manually create our Target Node, which was not explicitly included in the narrative: Car Overall Liking.
We are now ready for using the Independence of Causal Influence (ICI) approach to measure how each identified factor impacts overall customer satisfaction.
The ICI methodology operates on the principle that each dimension independently influences overall satisfaction, without interfering with other dimensions. This independence assumption significantly simplifies the analytical approach.
We select all nodes and navigate to Tools > Independence of Causal Influence (ICI).
In the ICI dialog, we select the Sum Combination Function with Amechanistic Local Effects.

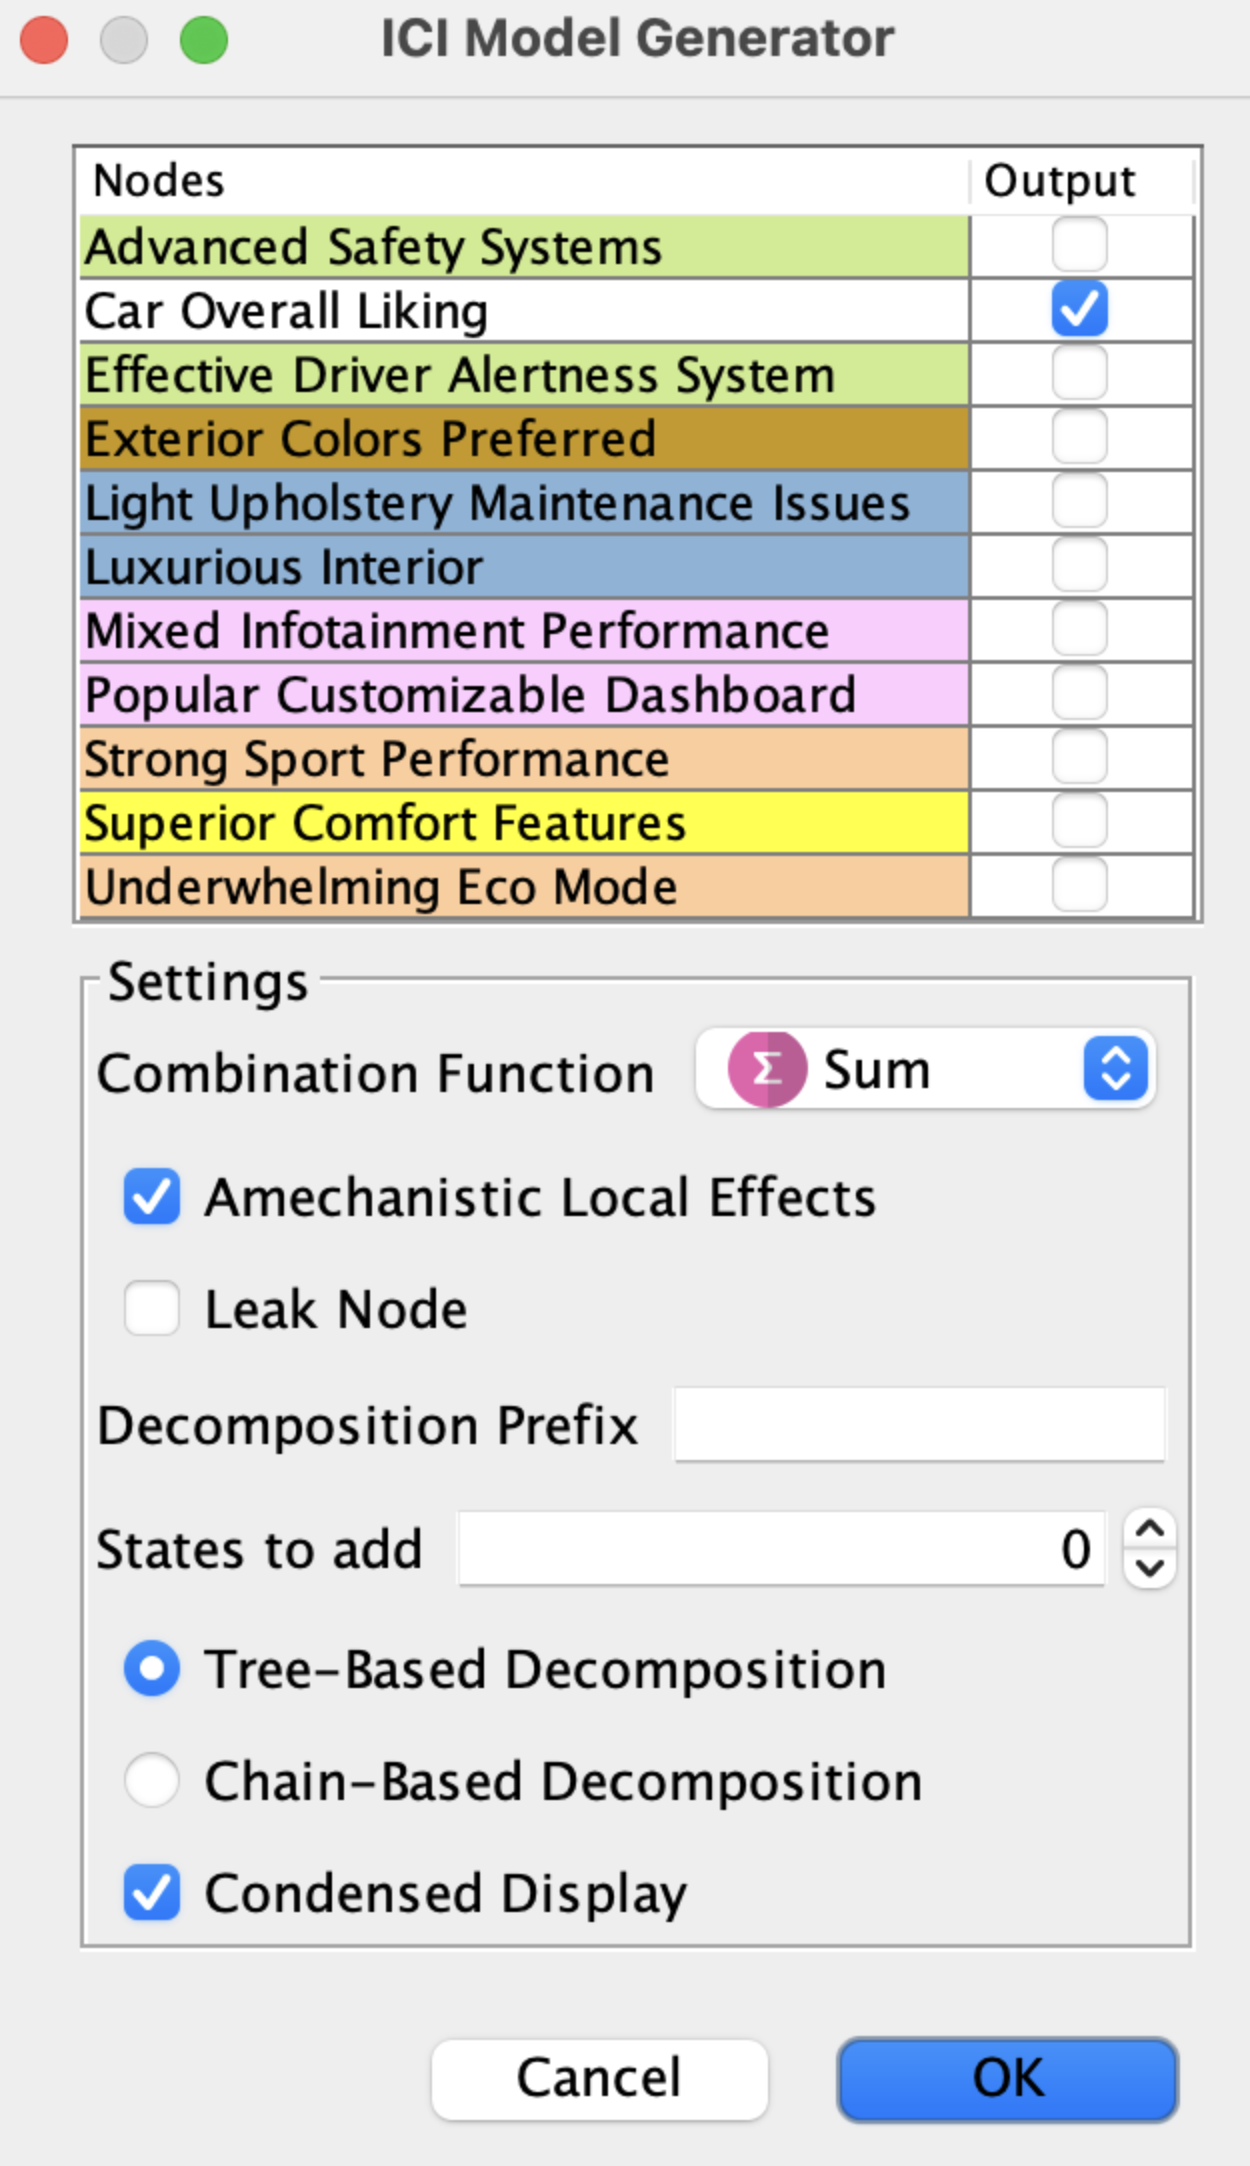

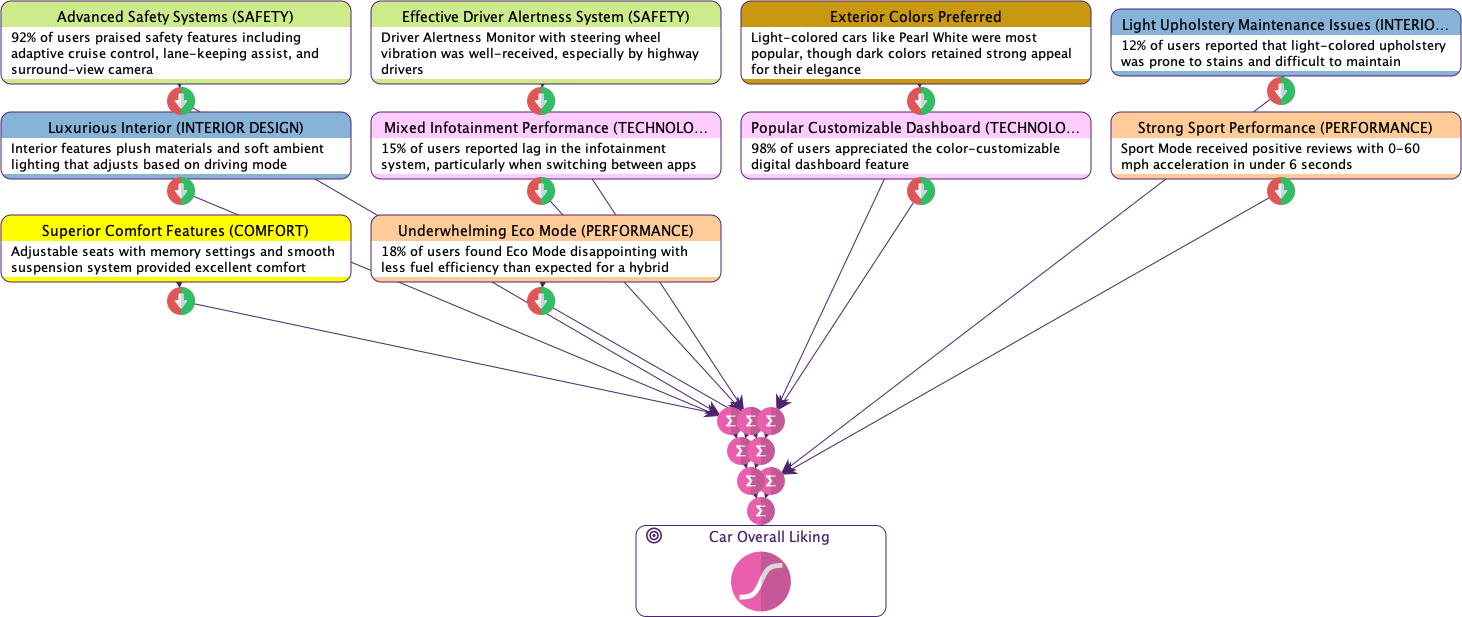
Since the Target node is Boolean, this process creates Local Effect Nodes with three states: -1, 0, +1, representing negative, neutral, and positive causal effects on the Target.

Using the Sum Combination Function, all local effects are summed together. This sum, which ranges from -10 to 10, is then transformed into a Boolean node using a Sigmoid-like function. This transformation allows us to map the cumulative influence of all factors onto the Target Node:

We now need to elicit the probabilities for this ICI model: prior probabilities for the root nodes (the factors), and their independent local effects. For this task, we implement a virtual brainstorming session where our group of experts consists of the available LLM engines. We ask each LLM to assess these probabilities (priors and local effects) along with a confidence level. Then, we use these votes and confidence levels to compute a consensus.
Eliciting Priors for Root Nodes
We select all nodes and navigate to Hellixa > Root Priors Elicitor.
For our group of ‘virtual experts’, we select five GenAI models:
- o1-mini
- mistral-large
- claude-sonnet
- gemini-pro
- llama-70b

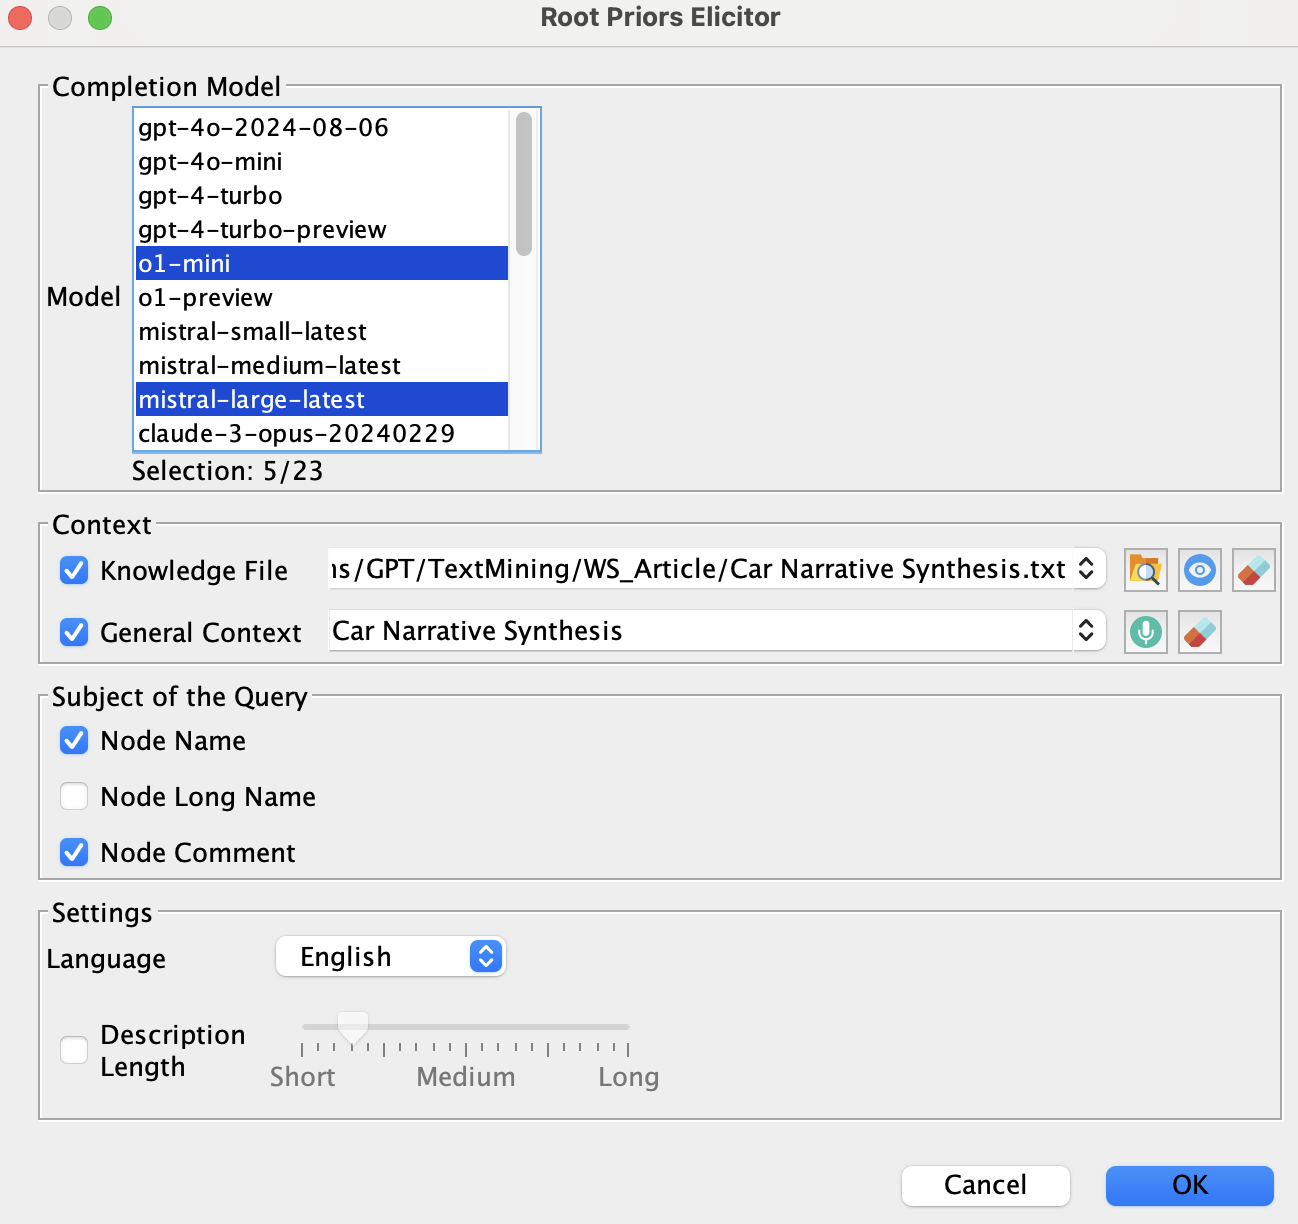
We keep the Context unchanged (the file containing the narrative and Car Narrative Synthesis as General Context). For the Query Subject, we use the Node name together with its associated comment.
Upon completion of the assessments, the network updates and root nodes display a new icon in the upper right corner.
This icon’s background color ranges from white (perfect consensus) to blue (high disagreement), helping us prioritize which elicited probabilities need review.

In our case, we observe no blue backgrounds, indicating good consensus among the assessments.
However, we still need to verify our LLMs’ outputs.
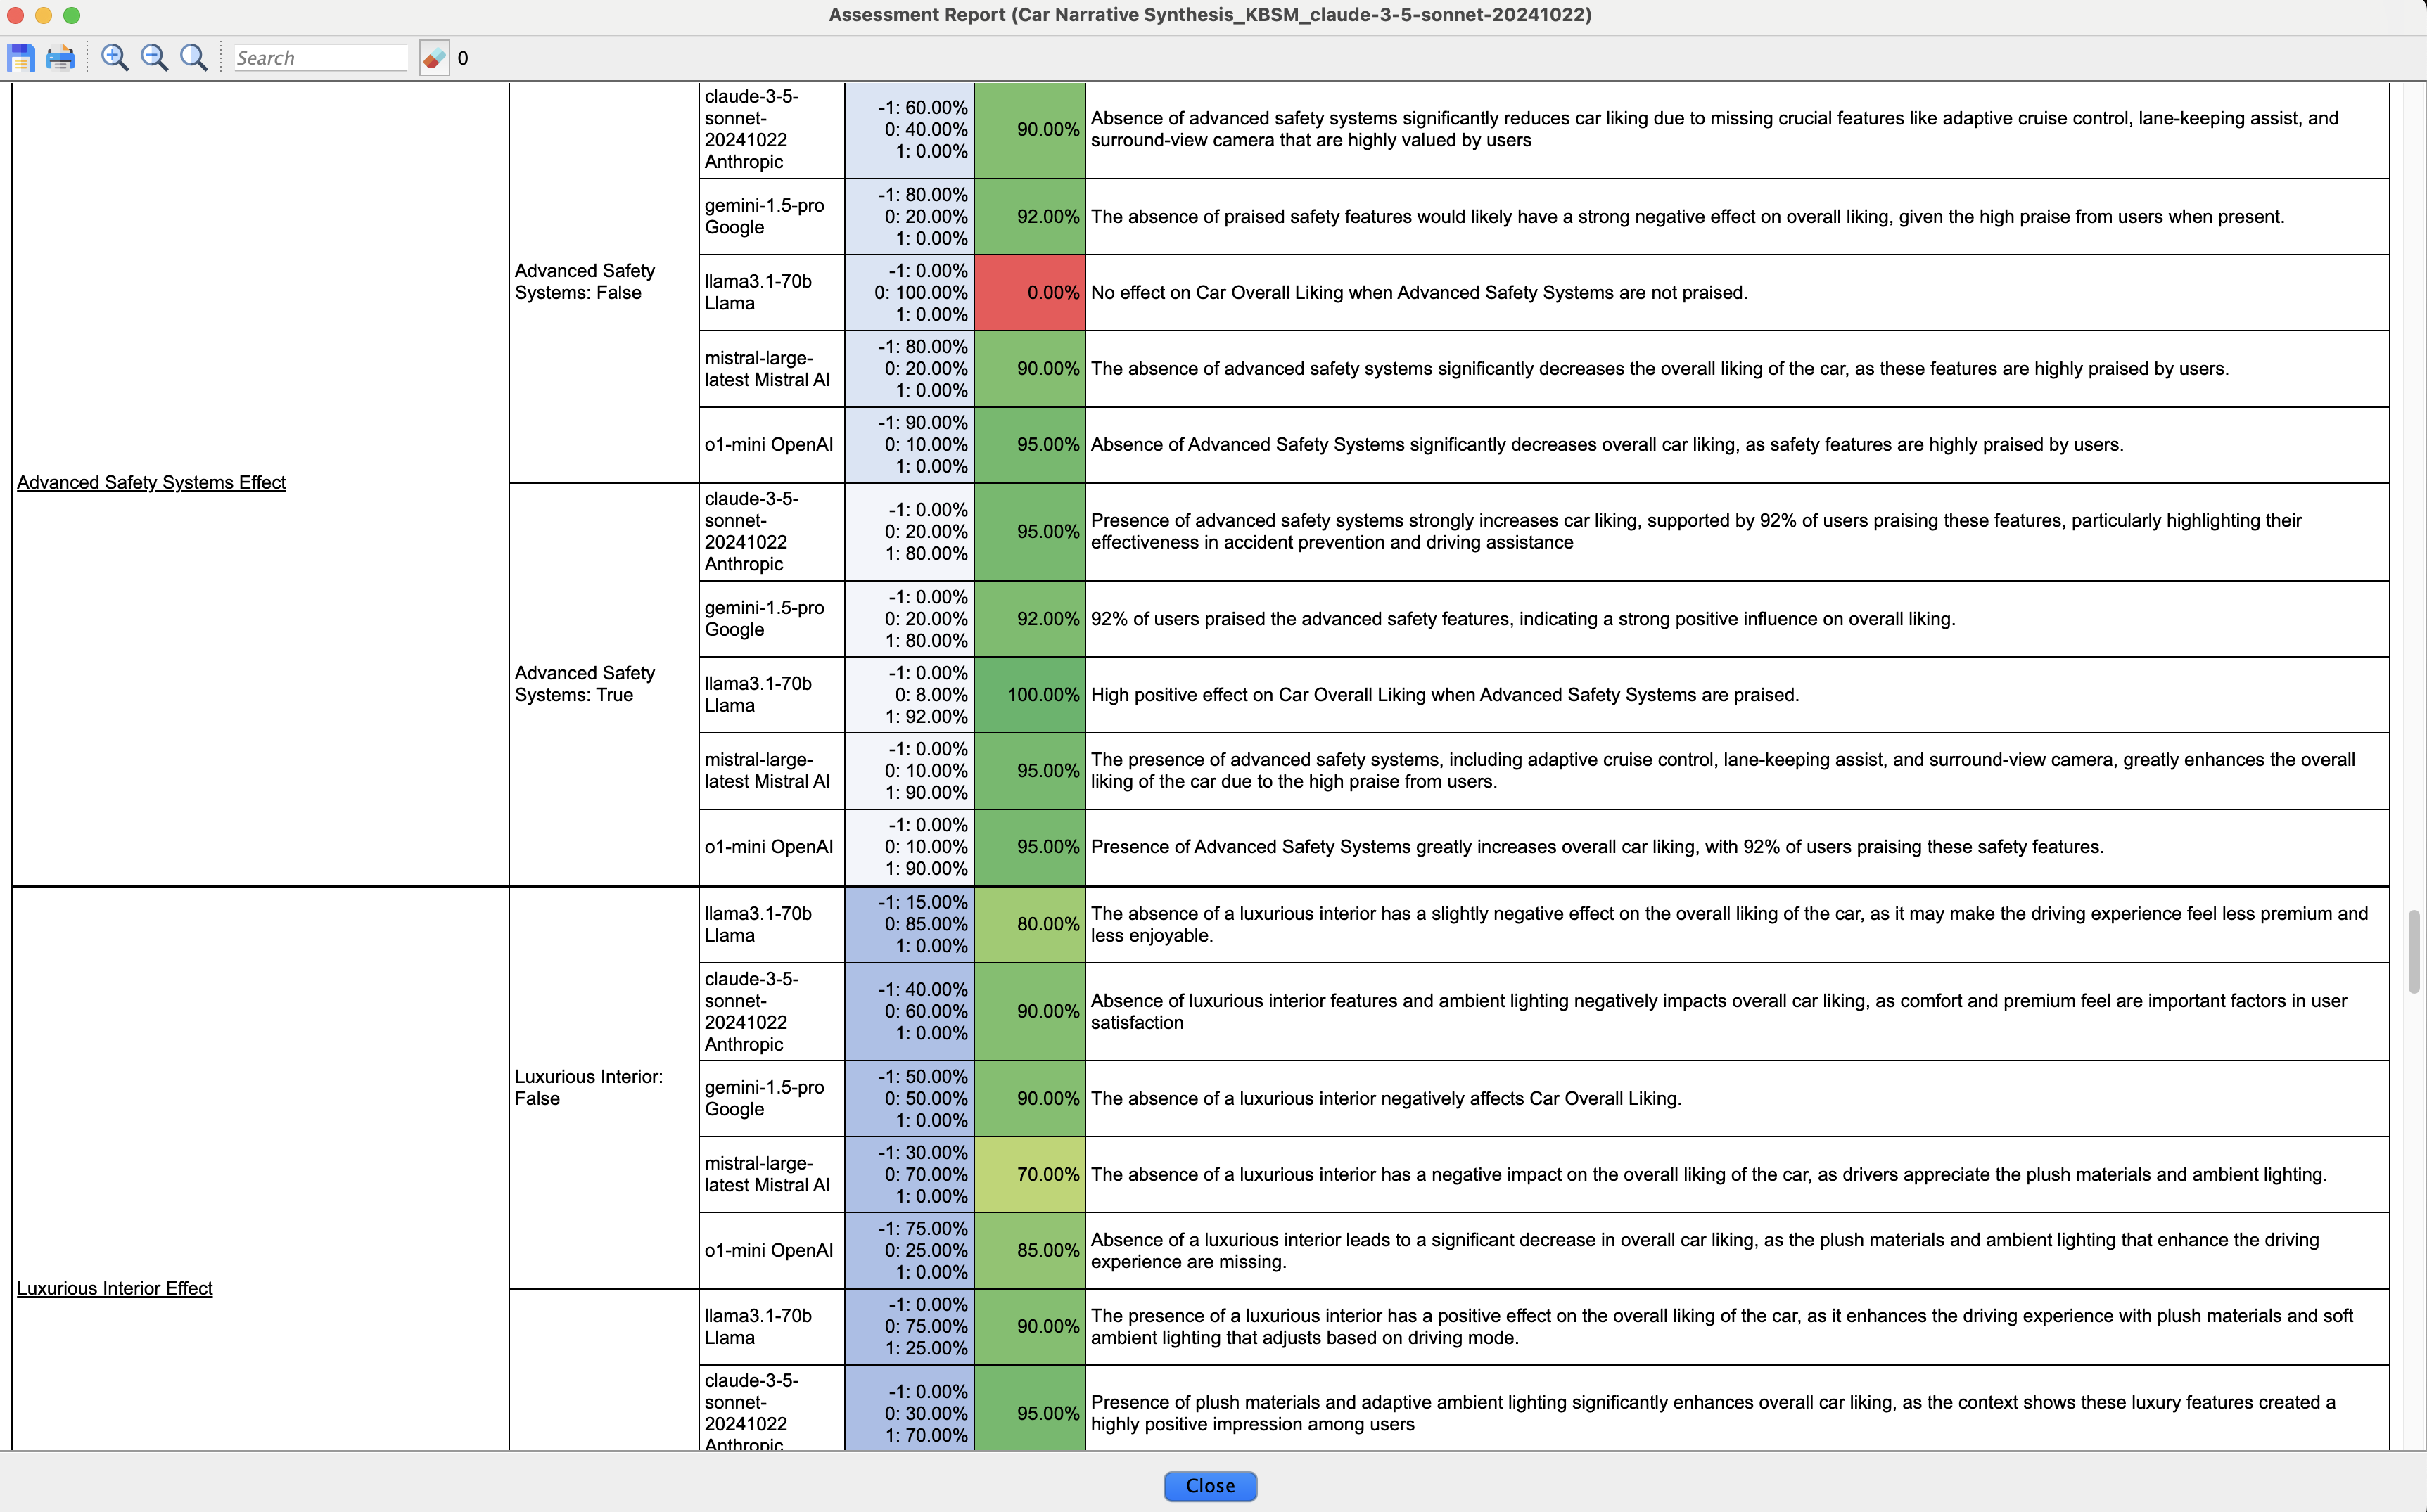
For efficient review, we generate an HTML report describing all assessments by navigating to Network > Reports > Assessments.

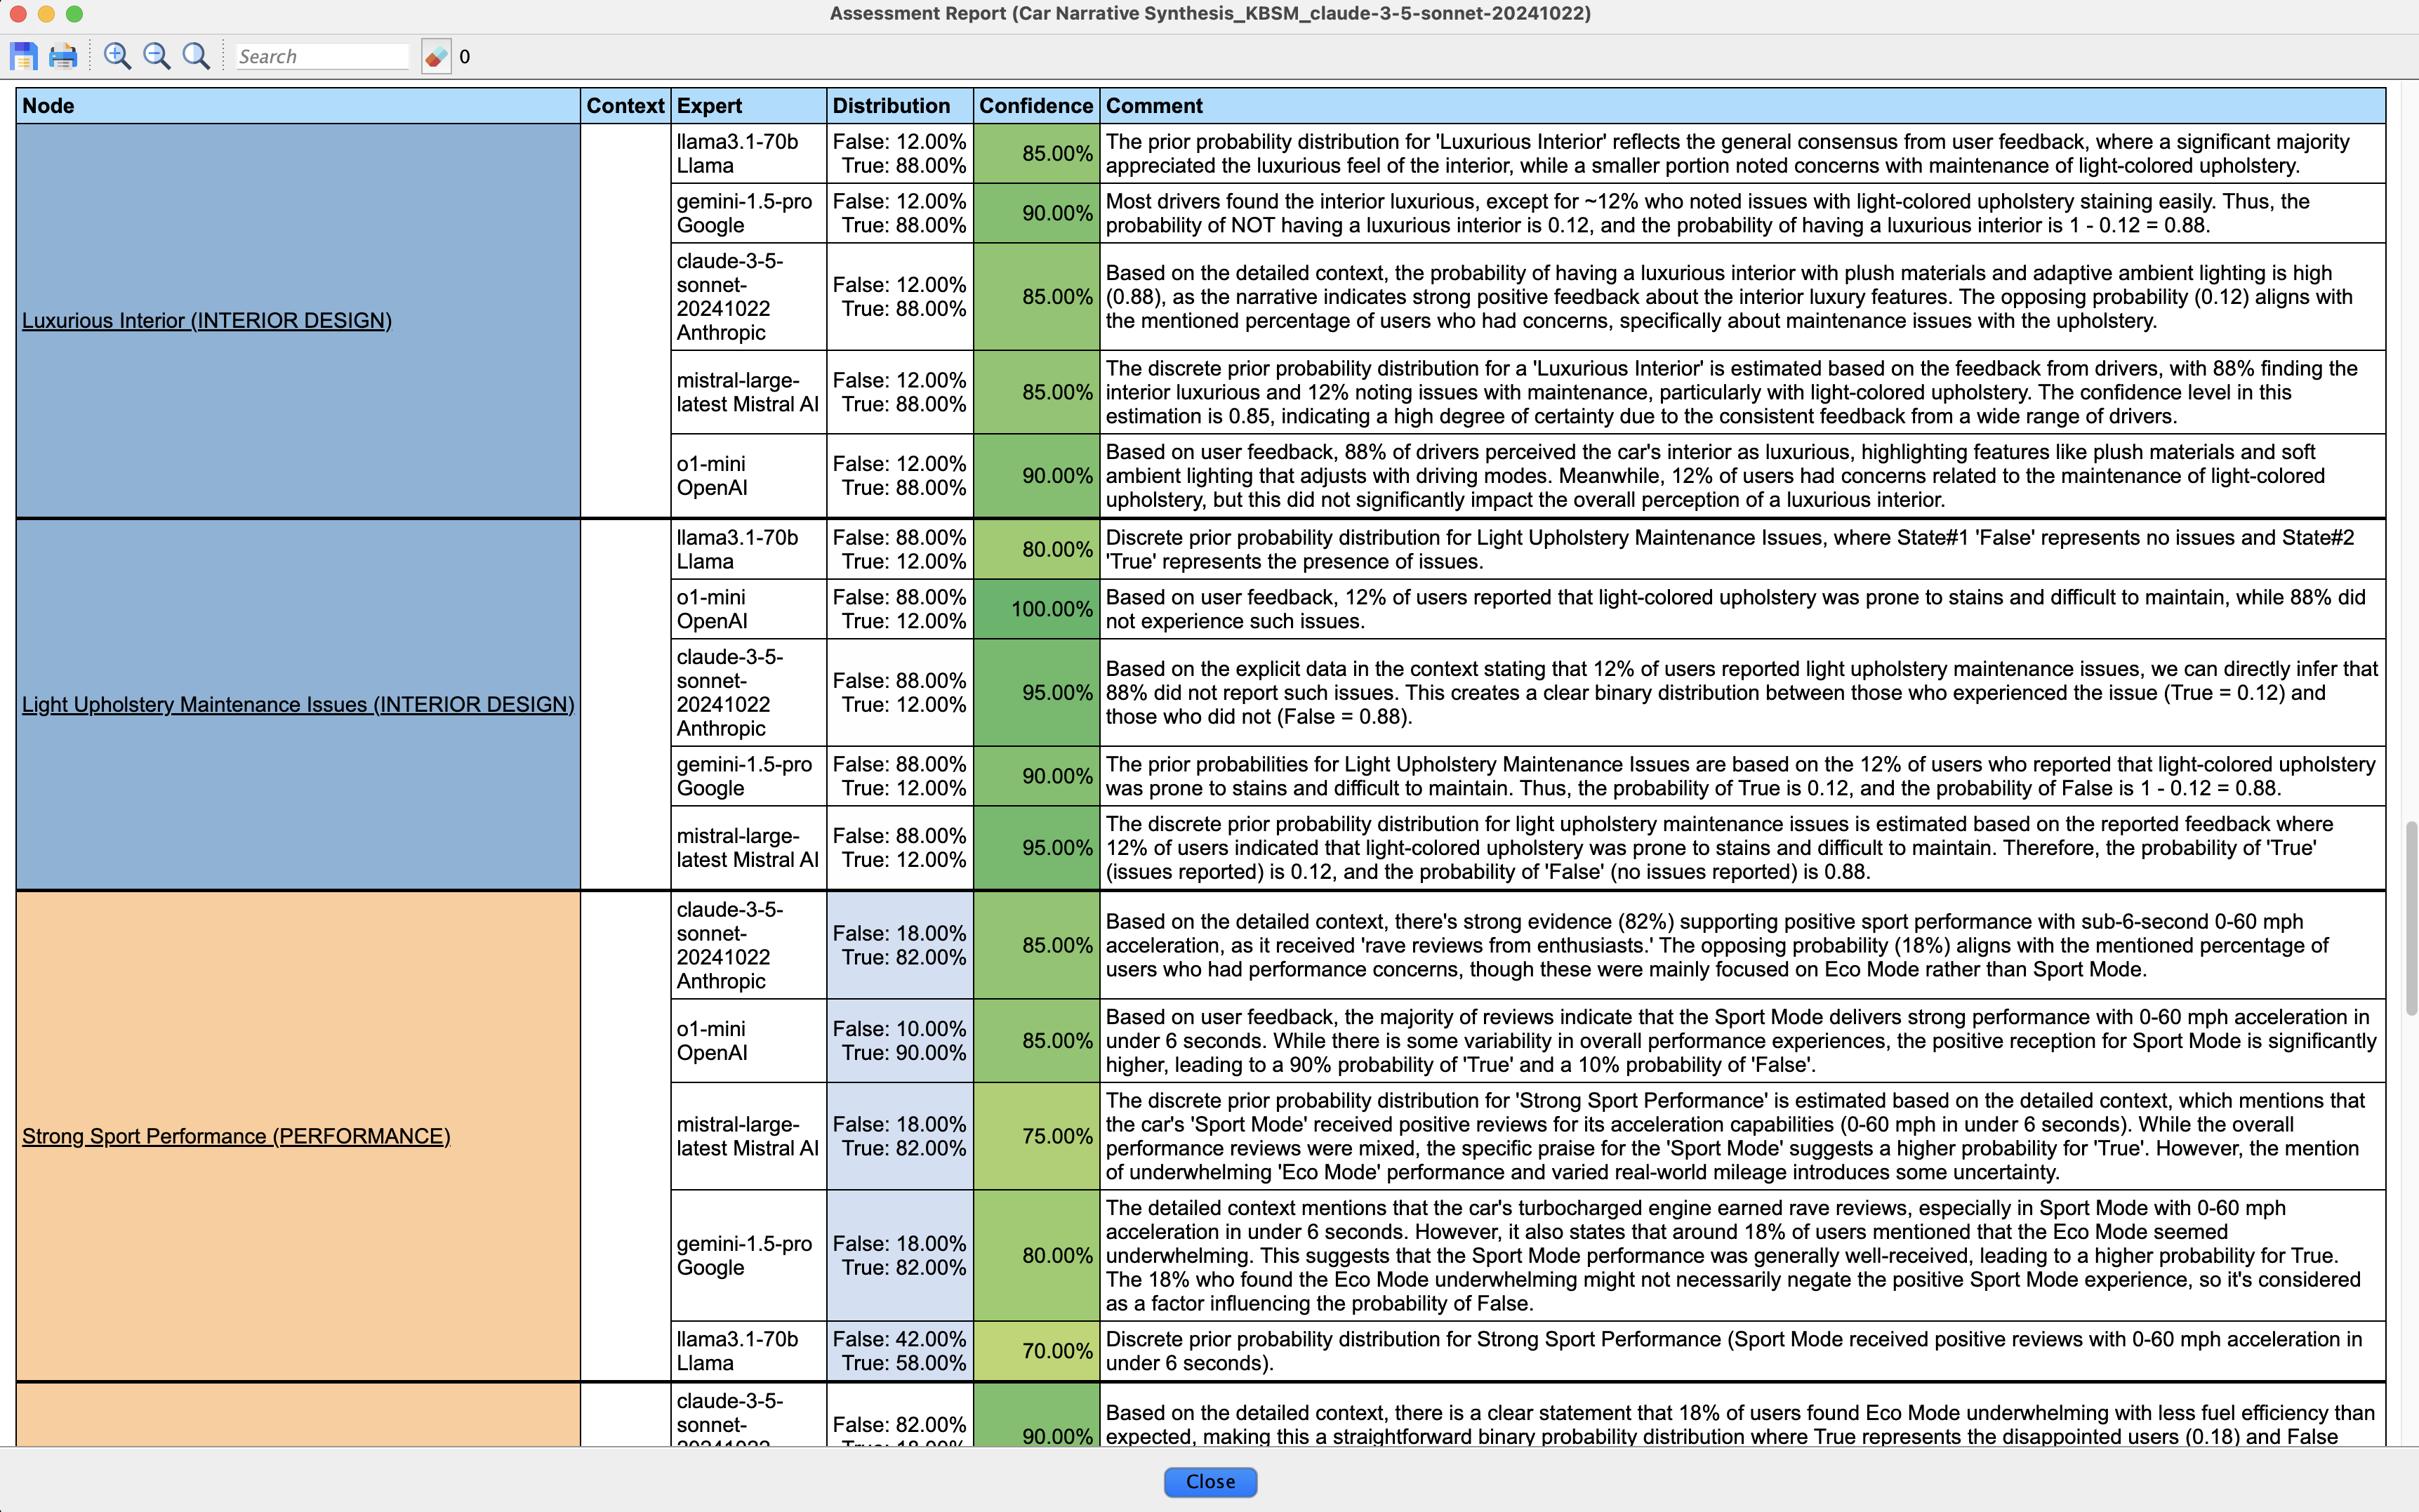
For each row of the nodes’ (conditional) probability table, this report returns the expert-assessed probabilities, their associated confidence levels, and comments explaining the assessment reasoning.
Akin to the expert’s icon, the background of the distribution cells ranges from white (perfect consensus) to blue (high disagreement). As shown in this screenshot, the distribution of Strong Sport Performance shows a light blue background, indicating mild disagreement. Looking closer, we see that llama’s distribution differs significantly from the others.
After checking against the narrative, we confirm that the other experts are correct. To address this, we can either:
- Delete this assessment,
- Set its confidence to 0 (which has the same effect),
- Edit the distribution to correct it.
We opt for the second option - setting the confidence to 0 - which allows us to maintain a record of this discrepancy if needed.
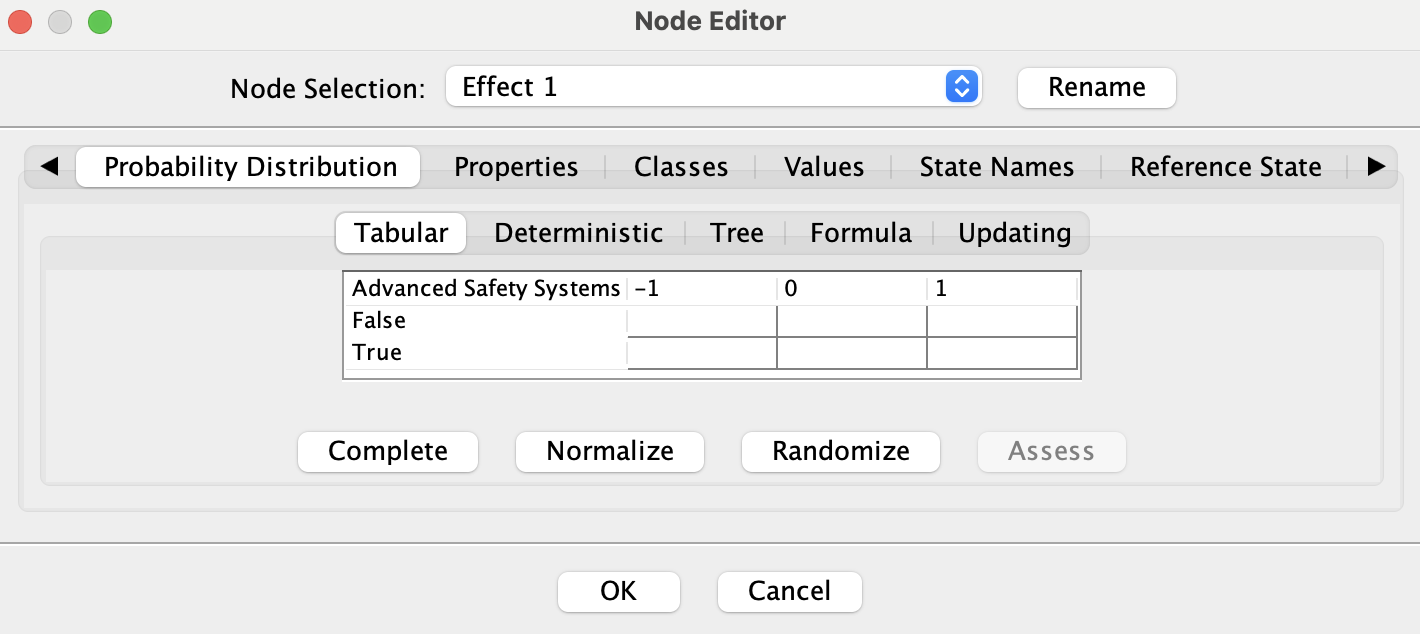
We open the Node Editor by double-clicking on Strong Sport Performance.

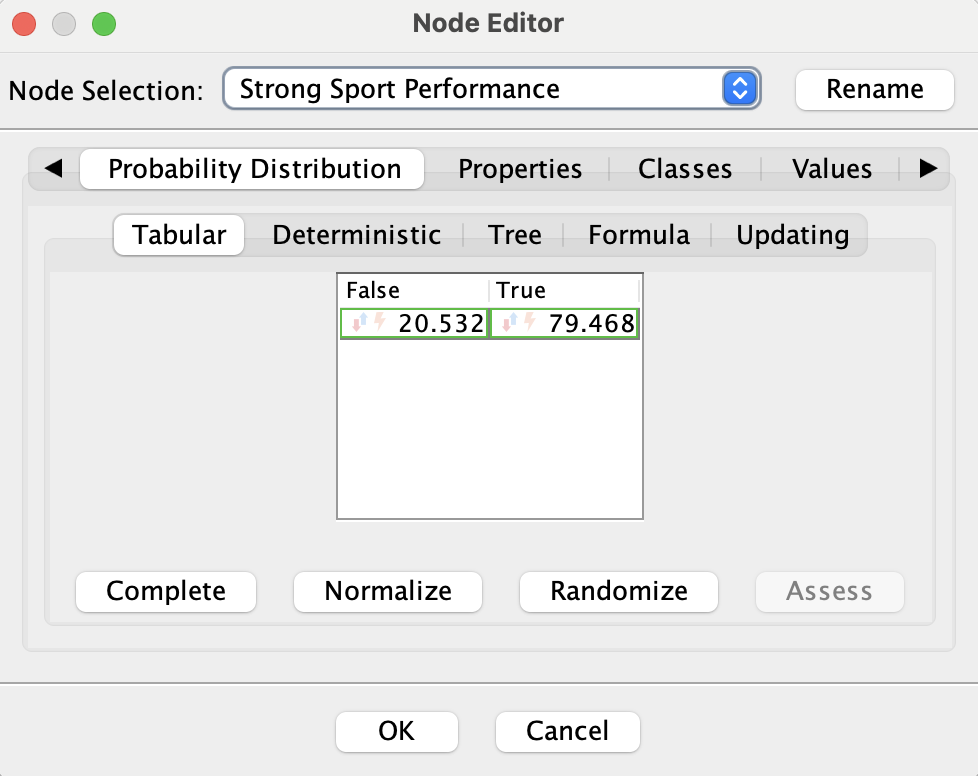
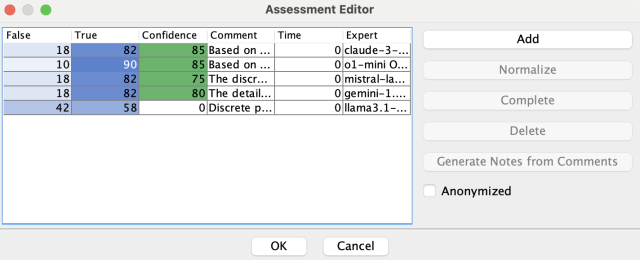
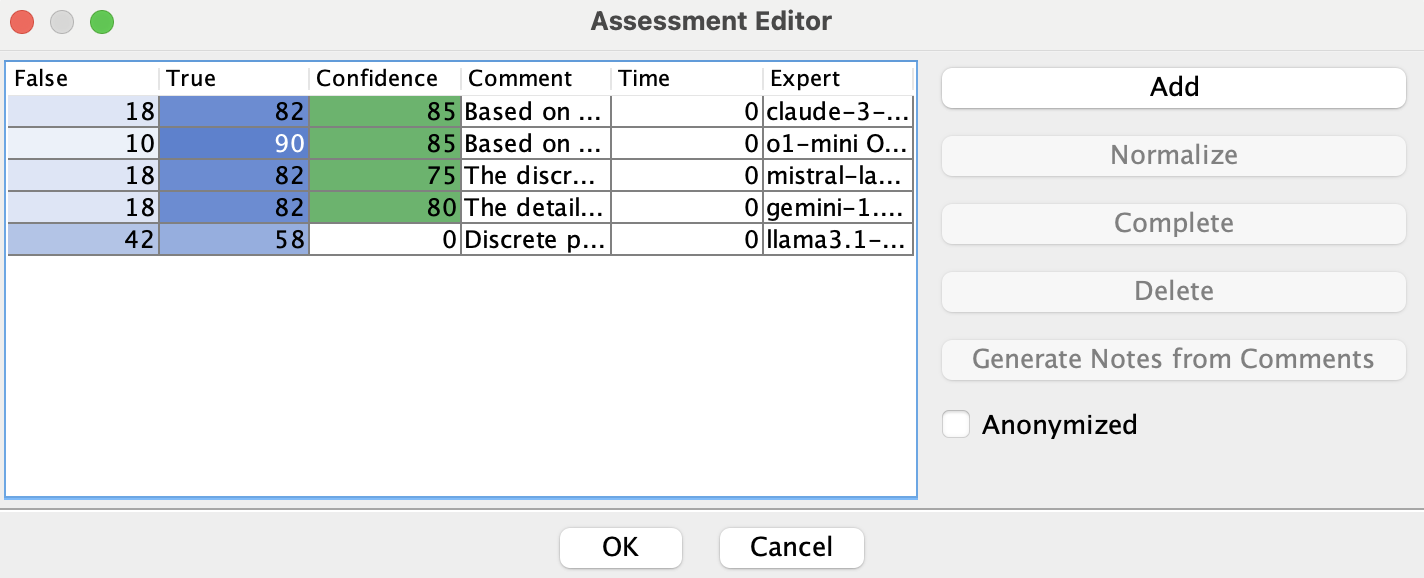
In the Probability Distribution tab, we click on a probability cell and then
the Assess button to access the Assessment Editor. There, we set llama’s
confidence to 0.
Using View > Node Style, we change the factors’ rendering from Badges to Monitors, allowing us to display the consensual prior distributions directly on the network in Validation Mode.

Eliciting Independent Local Effects
Now, we switch back to Modeling Mode to elicit the Independent Local Effects.
We select all nodes and navigate to Hellixia > ICI Local Effect Elicitor.
The dialog is identical to the Root Prior Elicitor, and we retain the exact same options as before.
This ensures consistency in the elicitation process across both prior probabilities and local effects.
Following the same hygiene practices, we generate the Assessment Report to review the outputs of the LLMs.
To do this, we navigate to Network > Reports > Assessments, just as we did for the root prior elicitation.
This report allows us to thoroughly check and validate the elicited local effects, ensuring accuracy and consistency in the model.

While the prior probabilities of the identified factors were directly available in the narrative or could be qualitatively extracted from the text, there is no explicit mention of Overall Liking. Consequently, the LLMs had to infer this information by applying sentiment analysis techniques in conjunction with the knowledge embedded within their neural networks. Given that this inference process inherently involves interpretation, mild disagreements among the experts are expected.
After carefully reviewing the Assessment Report, we did not find any obvious mistakes in the elicited assessments.
With all other nodes in our ICI model already parametrized (using the sum and sigmoid functions), our first model is now fully specified and we can proceed with driver analysis.
Visualizing Key Drivers with Quadrant and Tornado Analysis
Analyzing Driver Impact with Tornado Graphs
The most effective way to visualize the causal impacts of these factors is to create a Tornado graph (Analysis > Visual > Target > Target's Posterior > Tornado Diagrams > Total Effects).
Finding this feature through menus requires several clicks. To run it more quickly, you have two options:
- Set up a custom keyboard shortcut (
Window > Preferences > Perspectives/Shortcuts) - Use
Voice Function Searchin the toolbar, locate the function, then click theRunbutton to execute it.
Voice Function Search (v1.0) allows you to locate any function by speaking its name.
Just activate voice search and say part of the function name - for example, ‘tornado’ would help you find this feature.
Currently, you’ll need to know at least a portion of the exact function name, though future updates will support natural language descriptions.
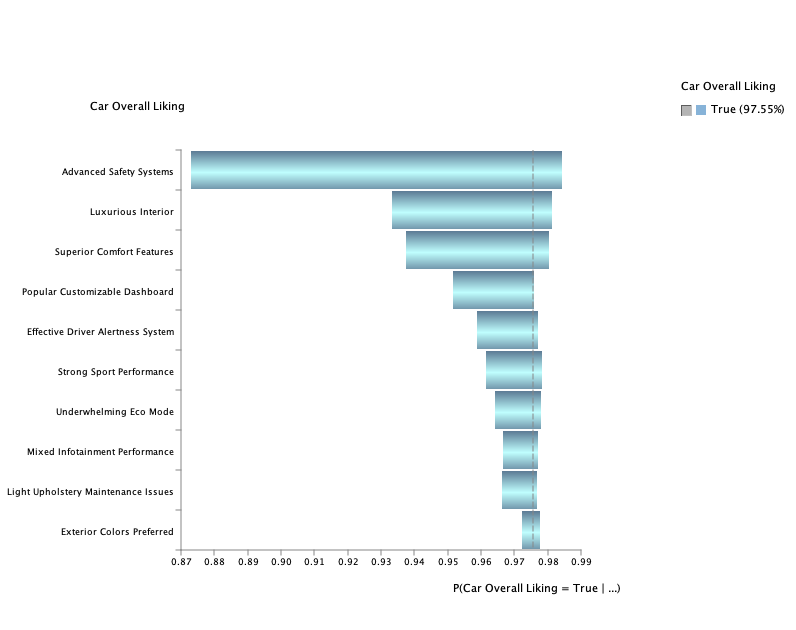
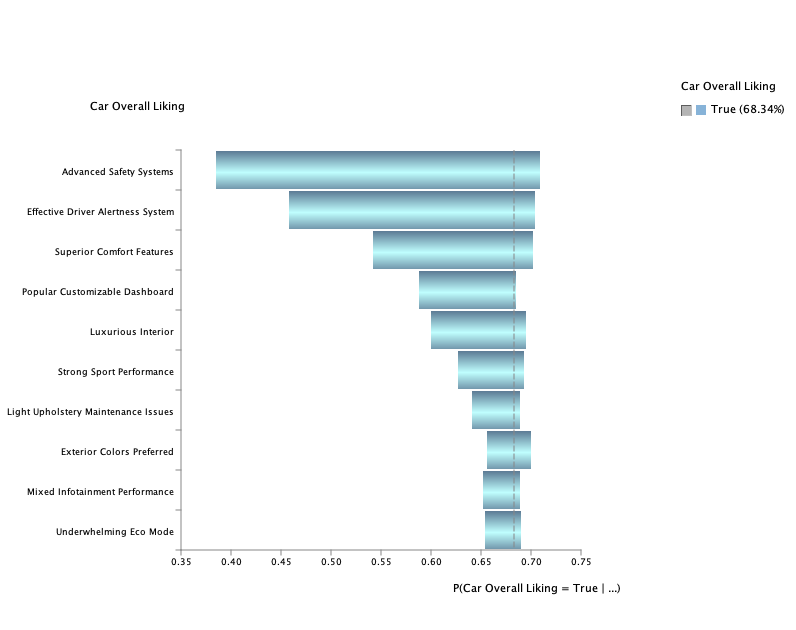
This graph provides a clear representation of how each factor influences the Car Overall Liking, showing the magnitude and direction of their effects. It is particularly useful for prioritizing factors that have the greatest impact on customer satisfaction.
Advanced Analysis of the Intermediate Sum Node
To define our Boolean Target node (Car Overall Liking), we used the sigmoid-like function automatically defined by the ICI tool to convert the total sum of all local effects (ranging from -10 to 10) into a Boolean output. While we previously analyzed the causal effects on Car Overall Liking, we now examine the intermediate Sum Node directly to see if it provides additional insights.
Below is the monitor displaying the marginal distribution of the intermediate sum node Sum 9, our new Target node:
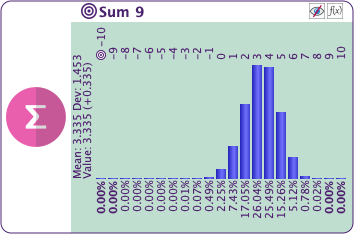
We generate a new Tornado graph to analyze its mean value. This approach allows us to focus directly on the intermediate node and assess how each factor contributes to its mean.
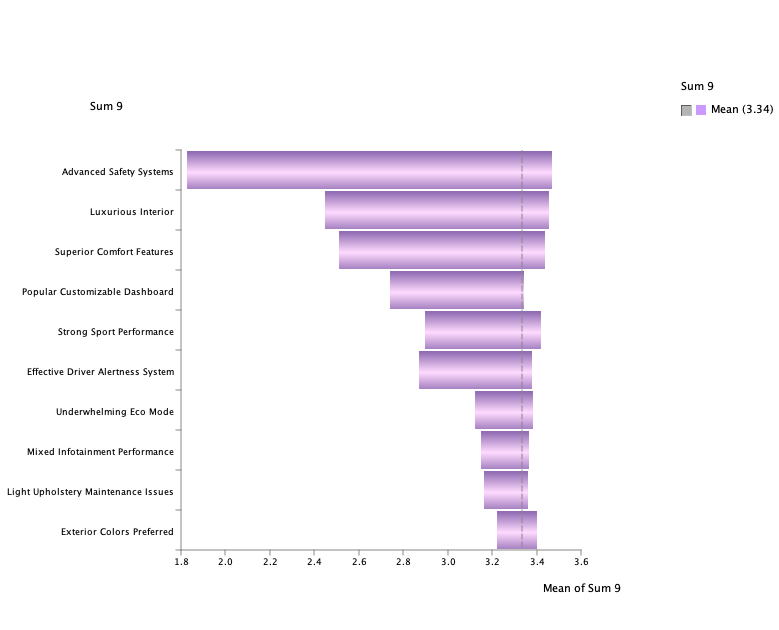
The Tornado graph for the intermediate sum node reveals that the same top factors—Advanced Safety Systems, Luxurious Interior, and Superior Comfort Features—continue to have the largest impacts, though their effects are now expressed in terms of their contribution to the mean value of the intermediate sum node. Additionally, the relative order and magnitude of some smaller factors, such as Strong Sport Performance and Effective Driver Alertness System, exhibit slight differences compared to the Boolean target graph.
This intermediate node provides a more granular view of each factor’s contributions before they are transformed into the binary outcome, offering a deeper understanding of how the factors aggregate to influence the final result.
We now return to our original Target Node, Car Overall Liking, for the next stage of our analysis. The upcoming Quadrant Analysis will provide further insights by mapping the likelihood and causal impacts of each factor, enabling a deeper understanding of their influence on overall customer satisfaction.
Mapping Driver Effects with Quadrant Charts
Another effective way to analyze the causal effects is to create a Quadrant Chart that plots each factor along two axes:
- X-axis (Mean Value): Represents the mean value of the factor, which in this model corresponds to the probability of the factor being True.
- Y-axis (Causal Effect): Represents the causal effect of the factor on Car Overall Liking, derived from the ICI model.
To generate the Quadrant Chart, we go to Analysis > Report > Target > Total Effects on Target and click the Quadrants button.
Each factor is represented by a triangle, which provides additional information:
- When the triangle points upward, the factor has a positive effect on Car Overall Liking when True.
- When the triangle points downward, the factor has a negative effect on Car Overall Liking when True.
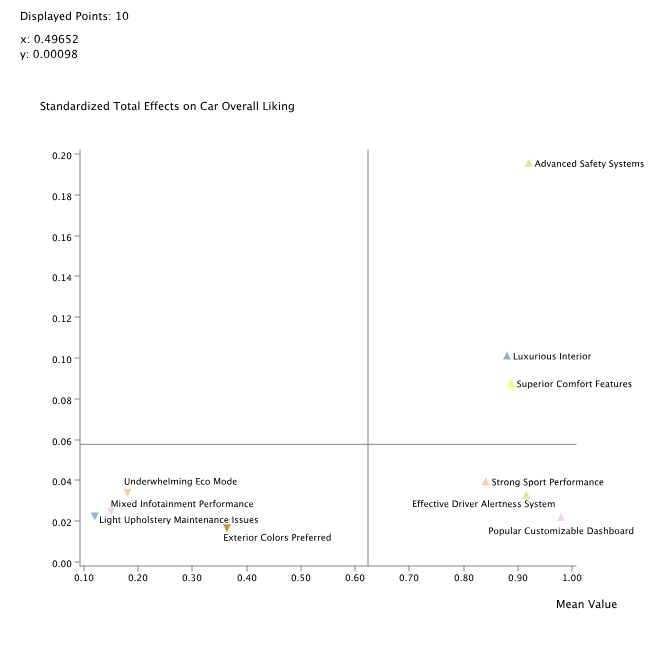
Factors are plotted in different quadrants based on their mean value (X-axis) and causal effect (Y-axis):
- High Mean & High Effect (Top Right): Factors that are both likely to occur and strongly improve or harm the target, e.g., Advanced Safety Systems.
- High Mean & Low Effect (Bottom Right): Factors that are frequent but have minimal impact, such as Popular Customizable Dashboard.
- Low Mean & High Effect (Top Left): No factors are present in this quadrant, indicating no rare but impactful factors in this analysis.
- Low Mean & Low Effect (Bottom Left): Factors that are both infrequent and have minimal impact, such as Mixed Infotainment Performance.
The absence of factors in the third quadrant suggests there are no rare but highly impactful opportunities in this model, simplifying the focus to factors that are either common or have modest effects. This combination of positional and visual cues (triangle orientation) makes it easy to assess both the likelihood and direction of each factor’s influence on Car Overall Liking, enabling strategic prioritization.
Adjusting the Sigmoid-Like Function for Target Conversion
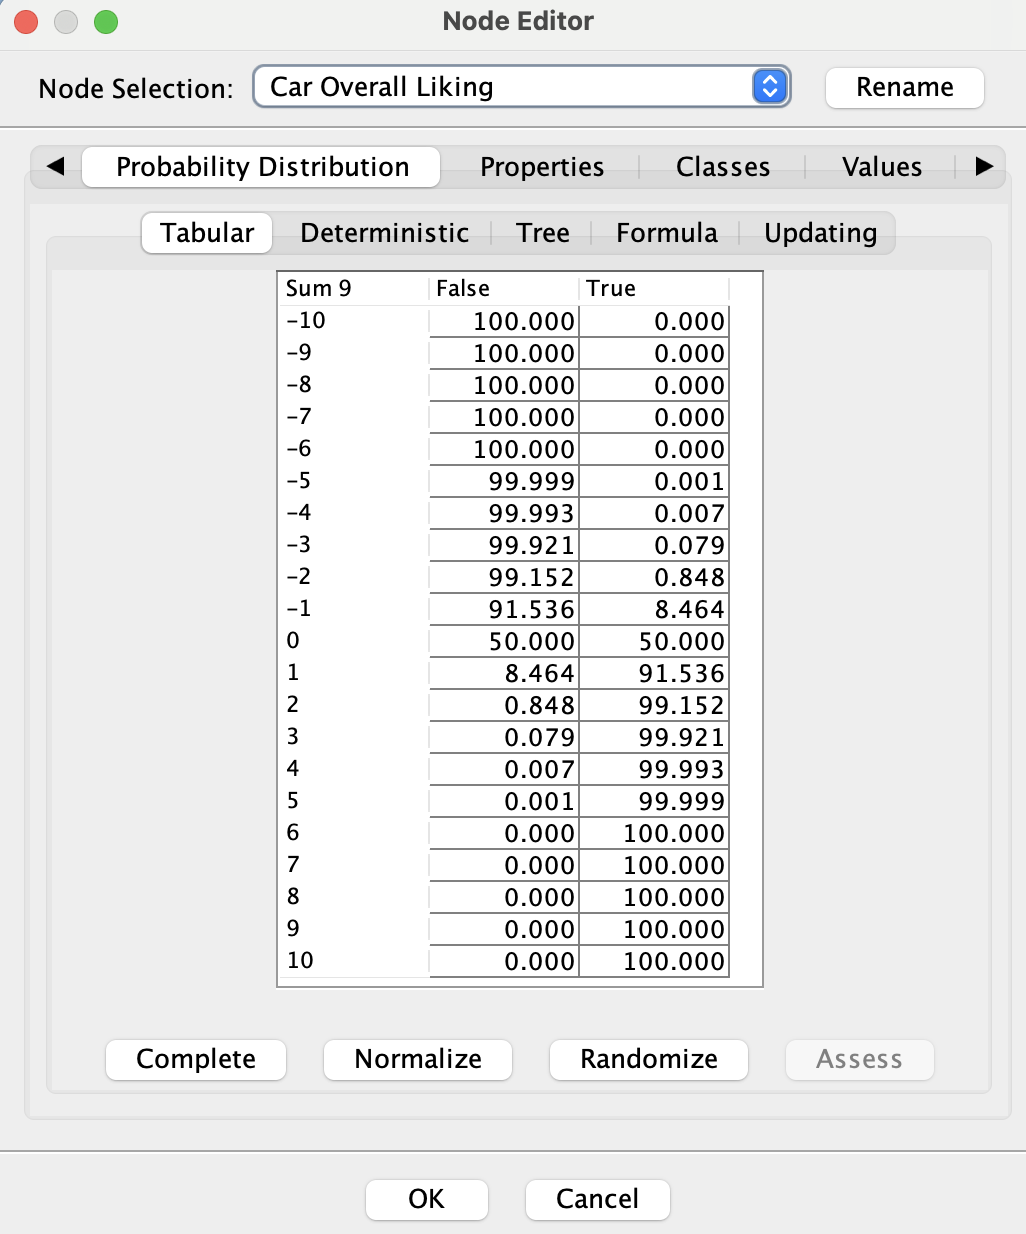
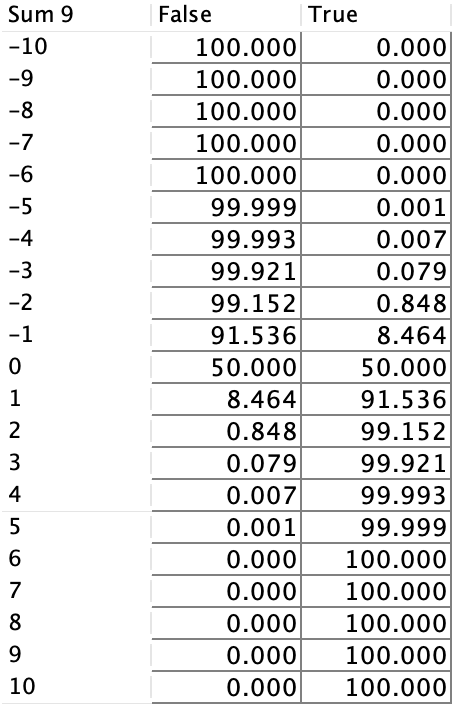
The sigmoid-like function that converts Sum 9 into the Boolean Target, Car Overall Liking, was initially generated automatically. However, upon reviewing the associated table (see below), we noticed that the generated probabilities are quite optimistic, e.g when the sum is equal to 0, we still have a 50% chance of overall liking.
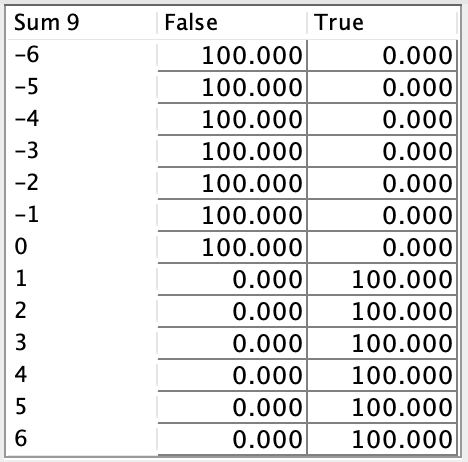
To address this, we manually edit the sigmoid-like function to produce a more balanced and realistic probability distribution. In the updated table, Car Overall Liking can only be True when the sum is greater than 0, and it is 100% True when the sum exceeds 3. This adjustment ensures a stricter and more interpretable relationship between Sum 9 and the Boolean Target, reflecting a more cautious and realistic threshold for achieving True.
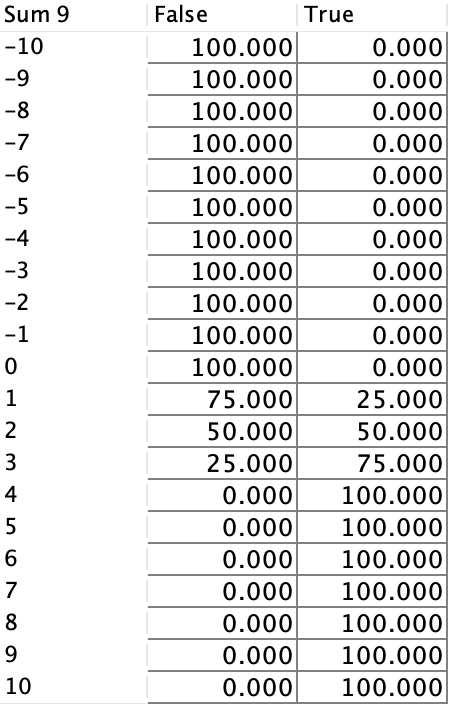
The marginal probability of Car Overall Liking has decreased by 20.98 percentage points, dropping from 97.55% to 76.57%.
The new Tornado graph for the Boolean Target closely resembles the Tornado graph previously generated for the mean of Sum 9.
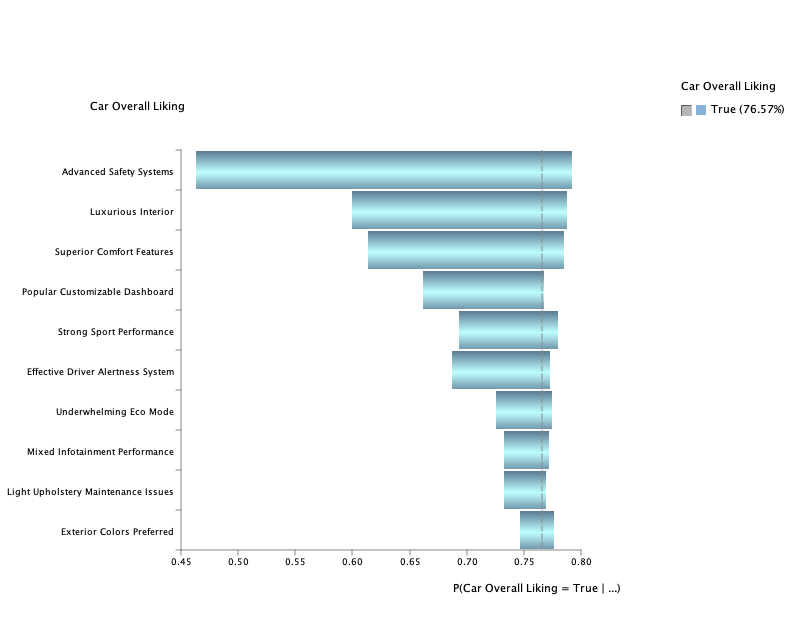
This similarity highlights how the stricter mapping aligns the Boolean Target’s behavior with the intermediate node, providing a consistent and cohesive view of the factors’ impacts.
By fine-tuning the sigmoid-like function, we achieve a clearer and more actionable framework for understanding how variations in Sum 9 translate into changes in Car Overall Liking.
Introducing Hierarchical Modeling for Thematic Grouping
During the analysis, we observed that the factors naturally align with identifiable themes, as indicated by the classes/colors assigned to the nodes. These themes provide an opportunity to restructure the model using Hierarchical Modeling, where we introduce latent variables to represent each thematic group.
This approach involves the following steps:
- Create a latent variable for each theme (Safety Overall Liking, Performance Overall Liking, Interior Design Overall Liking and Modern cockpit Overall Liking).
- Elicit the independent local effects of the factors on their associated latent variables.
- Elicit the independent local effects of the latent variables on the Overall Liking target node.
By organizing the model in this way, Hierarchical Modeling provides a structured, intuitive representation of how individual factors and thematic groups influence customer satisfaction.

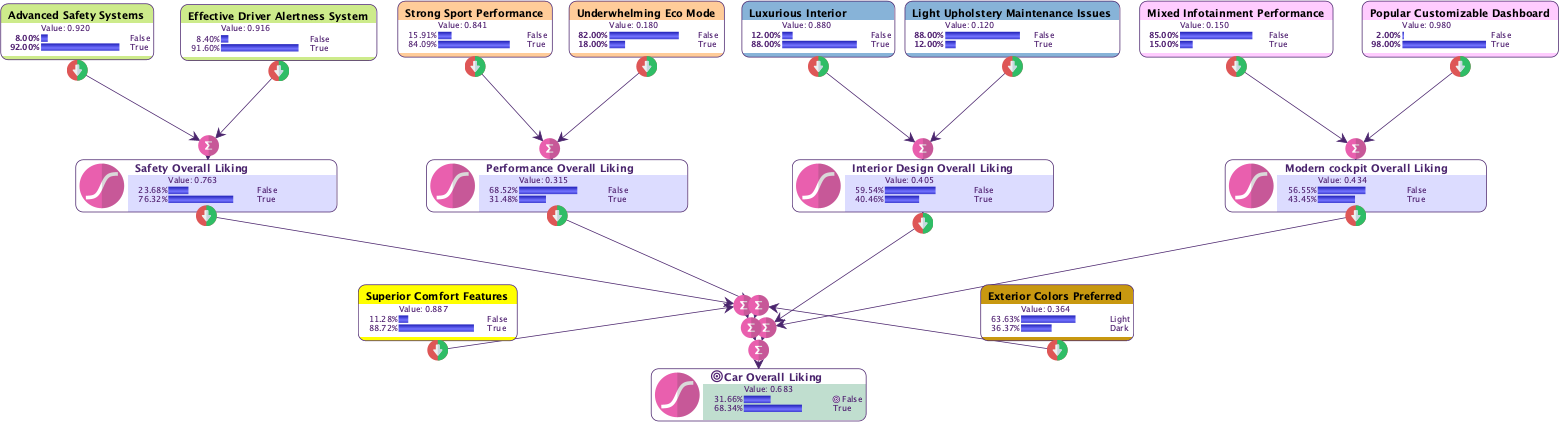
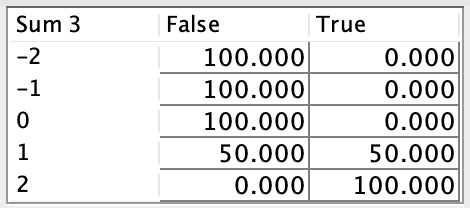
We also adjusted the Sigmoid-Like Functions for the latent variables to ensure their conversion from aggregated factors reflects a more balanced and interpretable relationship. The updated function, as shown in the table above, specifies that the latent variable can only be True when its aggregated Sum is greater than or equal to 1, with a 50-50 probability at Sum = 1 and reaching 100% True when Sum = 2. These adjustments provide a clearer and more consistent framework for how latent variables influence the model.
For the Target Node (Car Overall Liking), the Sigmoid-Like function was also adjusted to account for its updated structure, now influenced by six parent nodes: the four latent variables and two original factors (Superior Comfort Features and Exterior Colors Preferred) that do not belong to any latent group. The updated function, a threshold function as shown in the table above, establishes that Car Overall Liking is True only when the aggregated Sum exceeds 0.
The updated Tornado Graph reflects how factors now contribute through latent variables, providing a more balanced representation of their influence. 8 out of 10 factors affect the model through their respective thematic groups rather than directly, showing the impact of hierarchical modeling on factor relationships.
A notable change is the Effective Driver Alertness System, which moved from 6th to 2nd place due to its inclusion in the Safety latent variable.
- Advanced Safety Systems* continues to be the strongest driver of *Car Overall Liking*, with other factors now grouped more logically under their respective latent variables.
This graph shows the benefits of hierarchical modeling by combining thematic groups (through latent variables) with standalone factors, giving a complete picture of what drives customer satisfaction.
By analyzing the narrative feedback, we have uncovered the key dimensions driving Car Overall Liking and established a structured, causal framework using Hierarchical Modeling. In the next section, we shift our focus from aggregated insights to the granular analysis of 50 individual user feedbacks, diving deeper into the diversity of opinions and sentiments that shape overall user satisfaction.
Analysis of 50 Individual User Feedbacks
In this section, we analyze 50 individual user feedbacks, each consisting of short textual reviews where users express 2-3 key aspects they liked or disliked about the car (see the preview of the knowledge file Car Reviews.txt that we’ll analyze below).

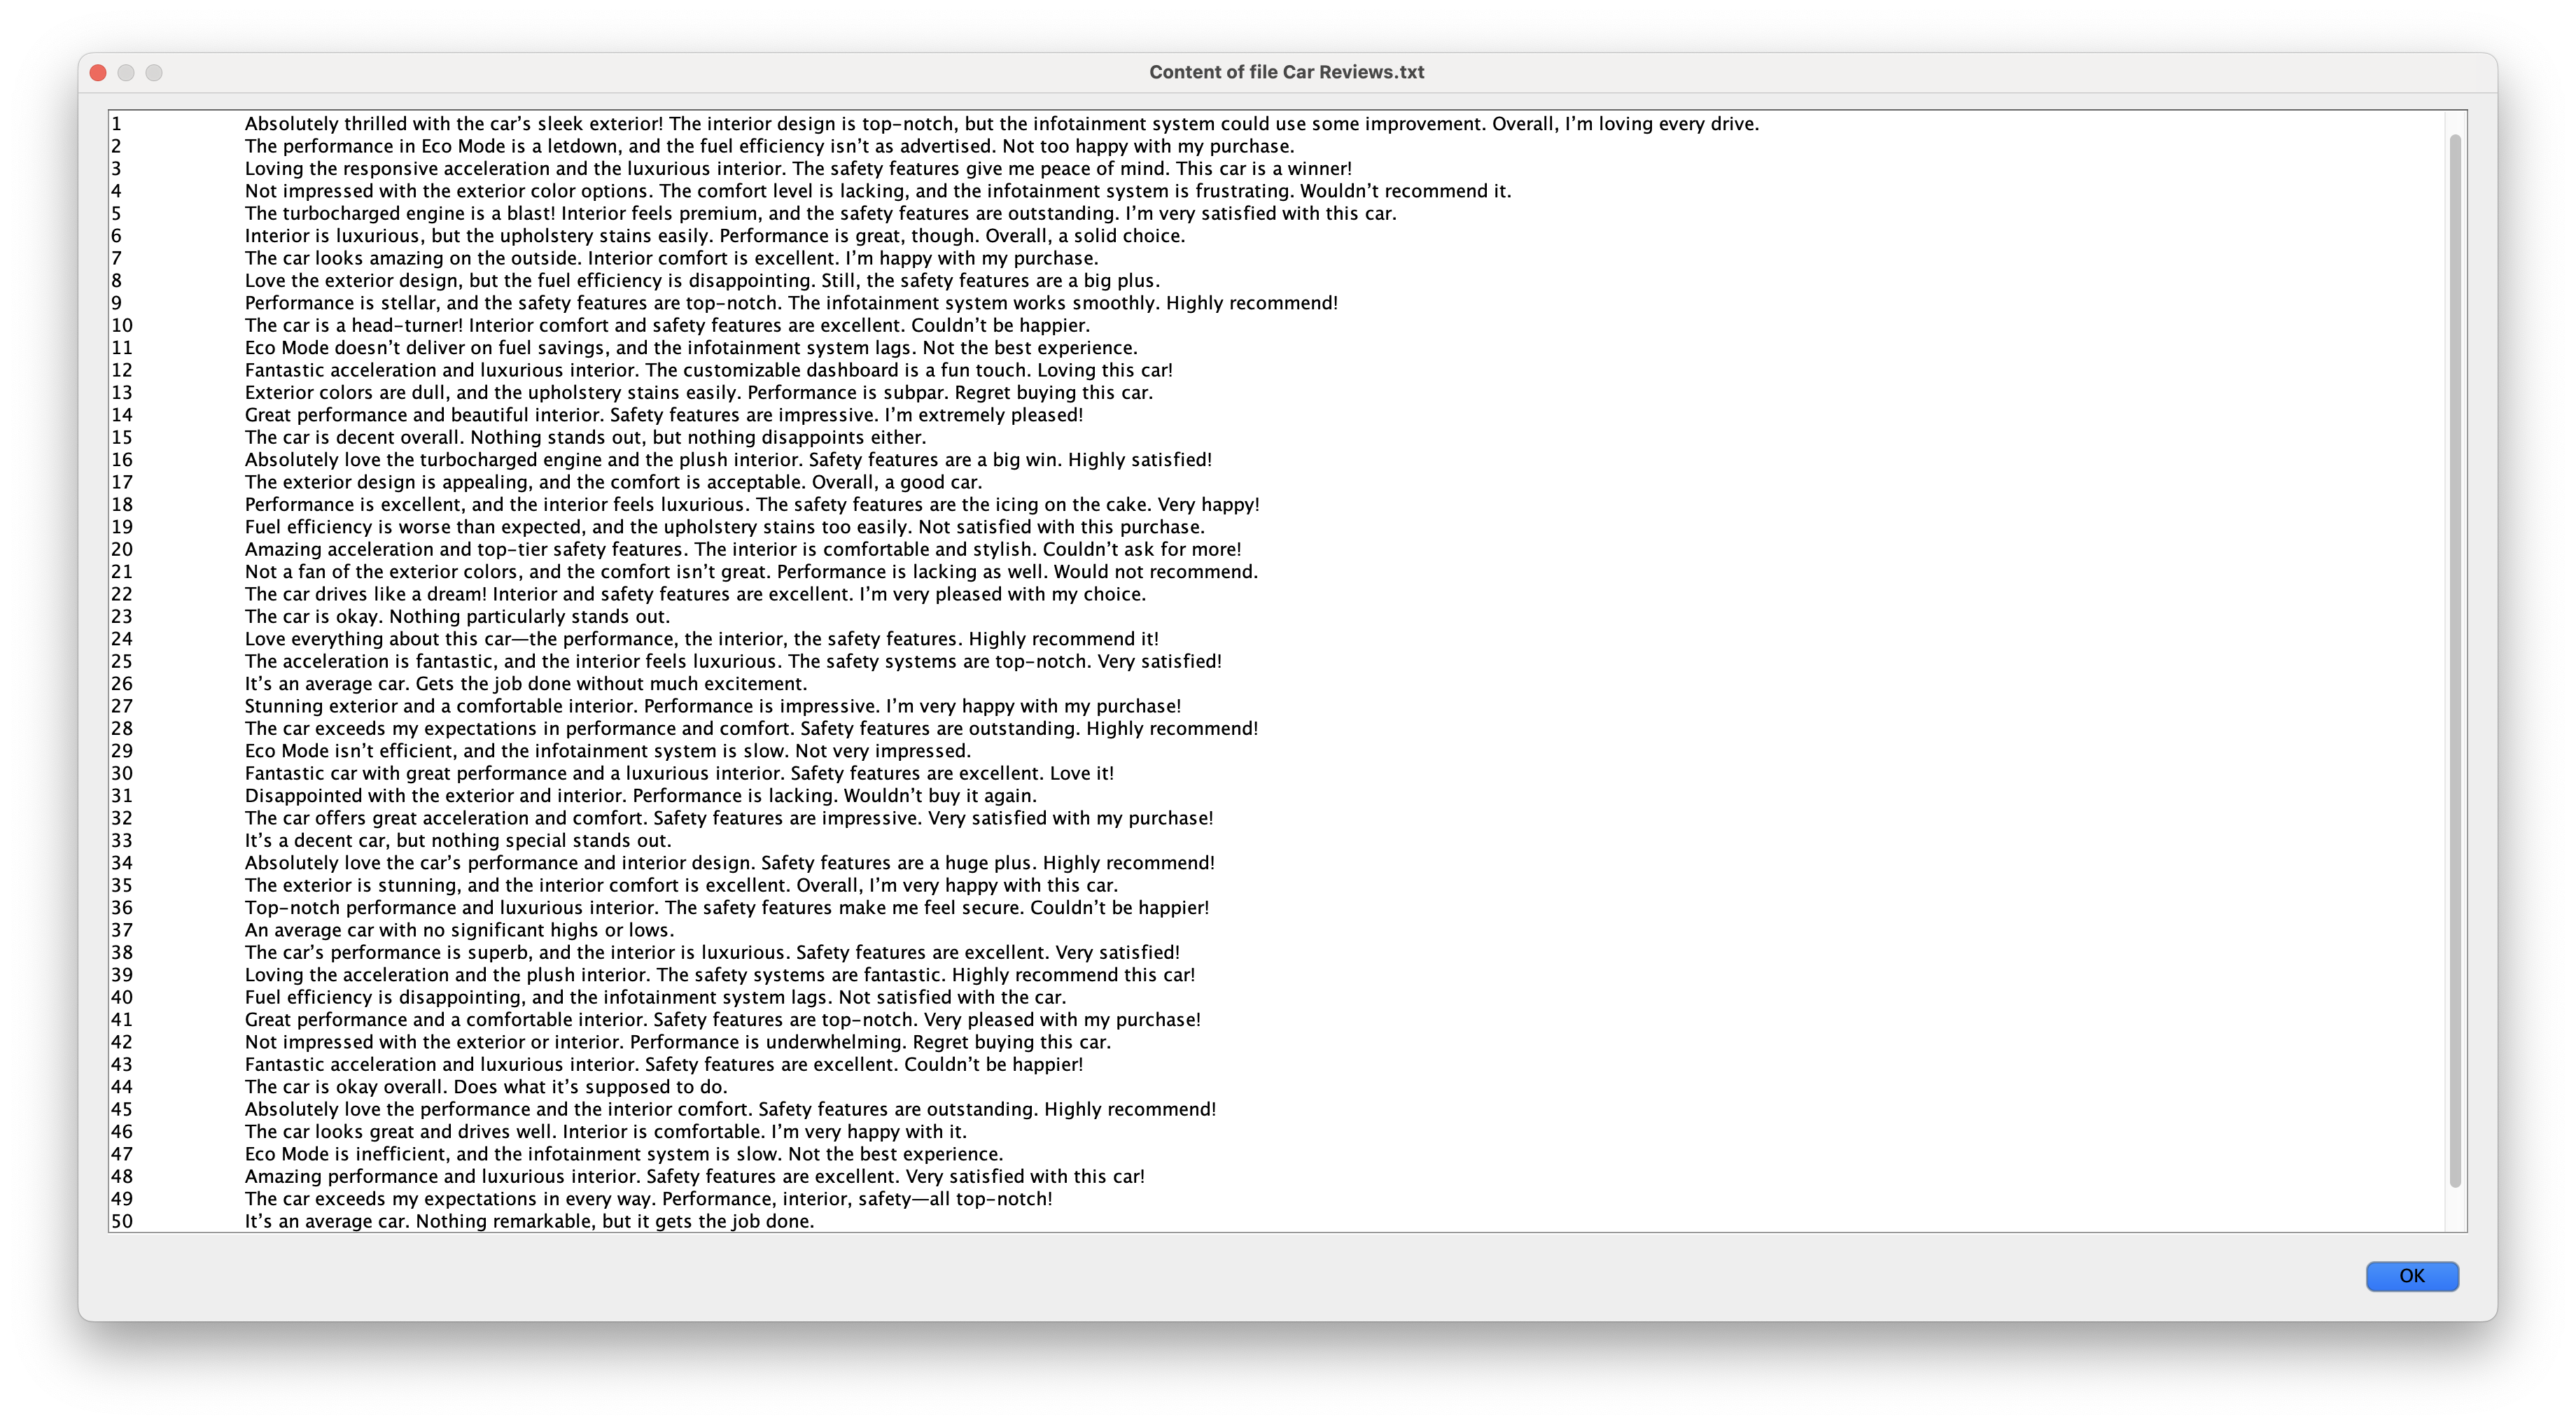
While the domain remains the same as in Section 1, the feedback in this section pertains to a different car model. Consequently, we do not expect to obtain identical outputs, as the evaluations reflect the unique features and characteristics of this particular model.
Unlike the previous section’s cohesive narrative, we now navigate through 50 independent stories, each offering distinct perspectives and priorities. This shift from a synthesized view to individual voices presents a new analytical challenge: uncovering patterns and insights across a diverse array of personal experiences.
To analyze these 50 individual user feedbacks, we will follow the same approach as described in the narrative analysis.
This involves extracting the key dimensions using Hellixia’s Keyword-Based Semantic Mapper, modeling their influence on the target node (Car Overall Liking) with the Independence of Causal Influence (ICI) approach, and eliciting both prior probabilities and independent local effects using a brainstorming-like method with multiple LLMs.
While the General Context in Section 1 was set to “Car Narrative Synthesis”, we now update it to “50 Individual User Feedbacks on Car Evaluations” to reflect the shift in focus.
As the steps are identical to those outlined in Section 1, we will not repeat the detailed explanation but will instead focus on the insights derived from this dataset.
Semantic Network with Key Dimensions
The semantic graph below represents the key dimensions extracted from the 50 individual user feedbacks.

Using Hellixia’s Keyword-Based Semantic Mapper, we automatically identified
these dimensions based on the user feedback, generated their embeddings, and
applied machine learning to structure the graph using the Maximum Weight Spanning Tree algorithm.
Each node represents a specific dimension of user feedback, such as Advanced Safety Features, Premium Interior Quality, or Superior Performance, while the connections between nodes illustrate their semantic relationships (correlations), based on proximity in the embedding space.
This graph provides a visual and thematic organization (keywords in parentheses) of the key aspects users highlighted, creating a foundation for further causal modeling and analysis.
Building a Hierarchical ICI Model
With the key dimensions extracted and structured into a semantic graph, we now move to the next phase of the analysis: constructing a Hierarchical Independence of Causal Influence (ICI) Model. This approach allows us to quantify how each dimension—individually and through thematic groups—influences the target node, Car Overall Liking.
In this hierarchical model, we introduce latent variables to represent thematic categories identified in the semantic graph, such as Performance Overall Liking, Interior Overall Liking, Technology Overall Liking, and Appearance Overall Liking. Each dimension contributes to its respective latent variable, which, in turn, affects the target node.
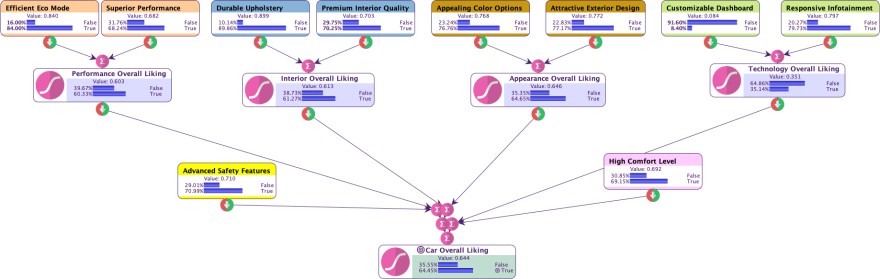

This layered structure enables a more intuitive and interpretable representation of the relationships between user feedback dimensions and overall satisfaction.
The Tornado graph below, based on the learned Hierarchical ICI Model, illustrates the impact of each factor on Car Overall Liking.
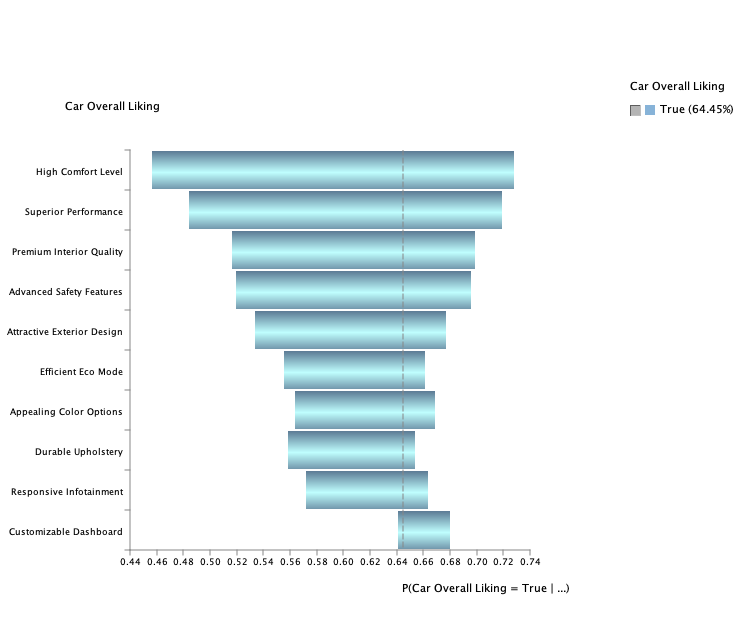
The High Comfort Level emerges as the strongest driver, followed closely by Superior Performance and Premium Interior Quality.
- Advanced Safety Features* and Attractive Exterior Design also contribute significantly to overall satisfaction. In contrast, *Customizable Dashboard* appears as “nice-to-have” feature, as it only increases the likelihood of overall liking.
Sentiment Analysis: Exploring User Emotions
We conclude this article with a sentiment analysis of the 50 individual user feedbacks.
Using Hellixia’s Keyword-Based Semantic Mapper, we focus on the keyword “Emotions” to extract and organize the emotional dimensions expressed in the feedback.
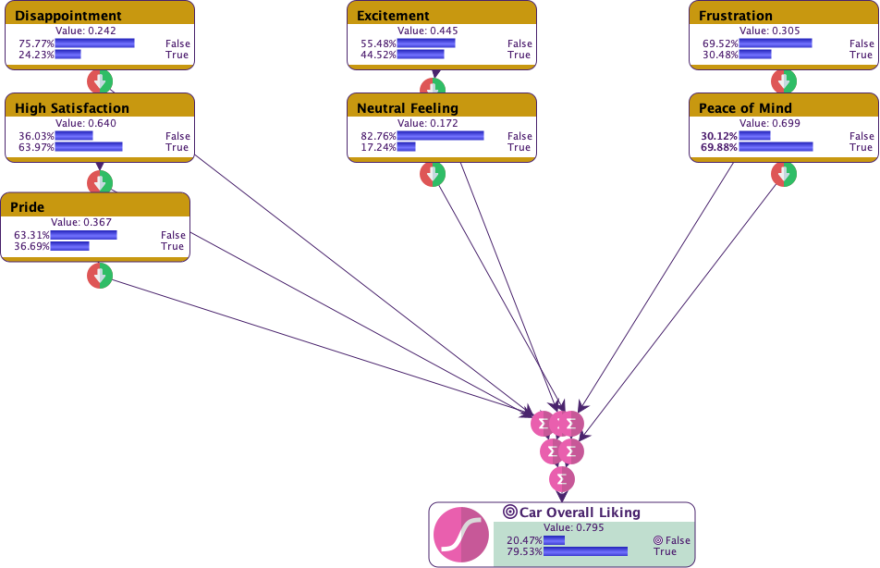
This process generates the semantic graph below that highlights the sentiments users associate with different aspects of the car, such as excitement, satisfaction, frustration, or disappointment.

These emotions are obviously not independent. However, we proceed to create an ICI model to gain an understanding of their local effects on overall satisfaction. We then create our target node, Car Overall Liking, and build the model to quantify the influence of each emotional dimension. By estimating the priors and local effects, we derive insights into how specific emotions impact overall satisfaction.
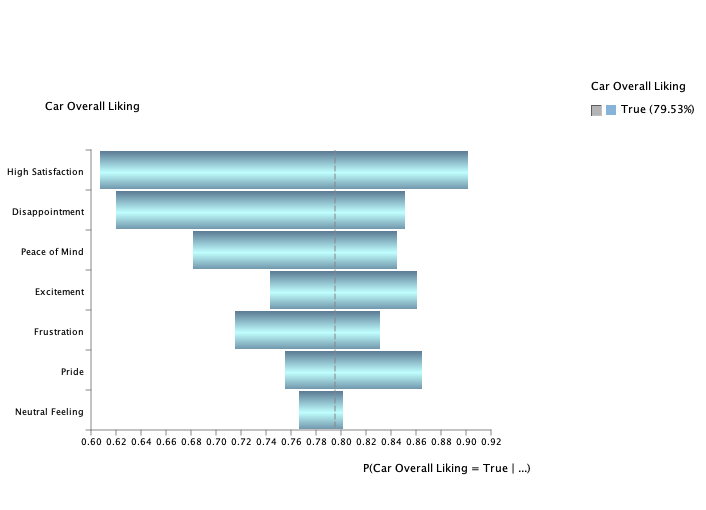
The Tornado graph below illustrates the individual effects of emotions on Car Overall Liking, highlighting (obviously) that High Satisfaction and Disappointment as the most important drivers.
The Quadrant chart offers a complementary perspective by categorizing emotions based on their likelihood (mean value) and causal impact (effect size). Each emotion is represented by a triangle, with its orientation indicating the direction of its effect: upward-pointing triangles signify positive effects (e.g., High Satisfaction and Peace of Mind), while downward-pointing triangles indicate negative effects (e.g., Disappointment and Frustration).
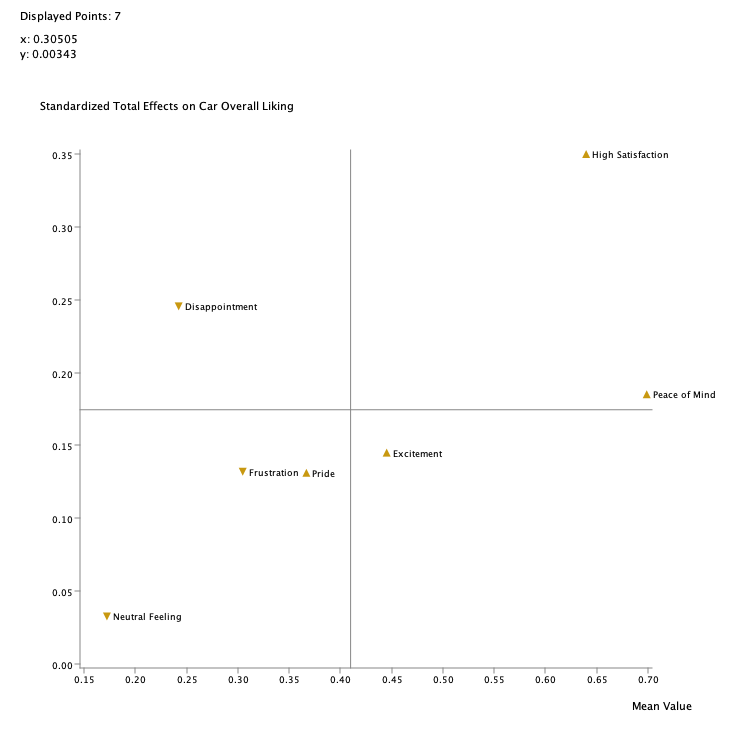
Together, the Tornado graph and Quadrant chart provide a comprehensive view of how emotional dimensions, their frequencies, and their directions of influence shape customer perceptions and satisfaction.
Conclusion
This case study highlights the power of leveraging advanced tools like Hellixia and BayesiaLab for analyzing unstructured textual feedback. By combining state-of-the-art semantic mapping, probabilistic causal modeling, and collaborative elicitation with multiple LLMs, we uncover actionable insights into what drives customer satisfaction across two distinct datasets.
In the first section, analyzing a cohesive narrative synthesis allowed us to identify overarching themes and key drivers of Car Overall Liking. Through Hierarchical ICI Modeling, we demonstrated the benefits of grouping related dimensions into thematic categories, leading to a more structured and interpretable representation of user preferences.
In the second section, we tackled the challenge of analyzing 50 independent user feedbacks. Despite the differences in input data, we followed the same robust methodology to extract dimensions, build a hierarchical causal model, and visualize their impact on satisfaction.
Finally, we concluded the analysis with a sentiment-driven exploration of user emotions. By isolating emotional dimensions such as High Satisfaction, Excitement, Frustration, we revealed their distinct influence on user perception and overall liking. The combination of Tornado graphs and Quadrant charts provided a comprehensive view of both causal effects and emotional prevalence, offering a nuanced understanding of user sentiment.
This study not only underscores the flexibility and scalability of the proposed framework but also demonstrates how advanced tools can transform raw textual feedback into valuable, data-driven insights. Whether analyzing aggregated narratives or individual user reviews, these methodologies pave the way for actionable strategies to improve product design, marketing, and overall customer satisfaction.