Multi-Quadrant Analysis
Context
Multi-Quadrant Analysis is commonly used in the context of Key Driver Analysis, e.g., when analyzing the “effects” or “impacts” of independent “driver” variables on a dependent “target” variable.
This type of analysis is often employed to evaluate surveys about consumer satisfaction with product features or service attributes. The features and attributes would be considered drivers (or key drivers), and a target could be a variable like “Likelihood to Recommend” or “Overall Satisfaction.”
The objective of such a driver analysis is to understand the relative importance of drivers, and the ultimate objective is to identify which features or attributes to improve in pursuit of increasing the target.
BayesiaLab’s Quadrant Analysis function in the Total Effects Report is a very practical tool for that purpose. The Quadrant Chart visualizes the current levels of the drivers (x-axis) and their respective importance regarding the target (y-axis).
Multi-Quadrant Analysis is very similar to the Quadrant Analysis function in the Total Effects Report. The prefix “Multi” in Multi-Quadrant Analysis refers to the additional dimension added to the Quadrant Analysis. More specifically, Multi-Quadrant Analysis allows us to compare drivers by segment. A segment could be defined by demographic characteristics, and one could compare the importance of drivers between male and female consumers. Similarly, drivers of satisfaction would likely be different for buyers of compact cars and luxury SUVs.
The Multi-Quadrant Analysis provides an easy way to compare the levels and importance of each driver between segments. As a result, managers can see the strengths and weaknesses of drivers in each segment and look for opportunities for improvement.
Terminology
- While the term “driver” suggests a causal relationship between a “driver” and the “target”, we are primarily evaluating associations.
- So, “impact” and “effect” refer to the associated change in value of the target when observing a change in a “driver.” As a result, “impact” and “effect” cannot automatically be interpreted as causation.
- But, despite the risk of an incorrect causal interpretation, we use the terms “driver”, “effect”, “impact”, and “target” because of their simplicity and ease of understanding without requiring technical explanations. In the context of BayesiaLab’s nomenclature, we formalize these terms as follows:
- Independent Key Driver Variable: Driver Node
- Target Variable: Target Node
- Impact and Effect: Total Effect (unless otherwise stated)
Example
This example is taken from Chapter 8 in our e-book and represents a key driver analysis of purchase intent for a range of perfume brands.
The dataset consists of responses to survey questions about the respondent’s perception of attributes and imagery associated with a perfume brand.
In the network created from this dataset, the Target Node represents the for each respondent with regard to the evaluated perfume brand.
In the dataset, each perfume brand is represented by a state of the node . So, each state of the node stands for one perfume brand.
All other nodes in the network are Driver Nodes, which represent each respondent’s set of perceptions regarding the evaluated perfume brand. We will analyze these Driver Nodes with regard to their impact on the Target Node . In other words, we want to know which perfume characteristics have the potential to increase the .
Usage
-
Performing a Multi-Quadrant Analysis has several requirements:
- The Graph Window must be in Validation Mode
F5. - You need an existing network with an associated dataset.
- A Target Node must be specified in the network, in our case .
- A Discrete Node must be available as the Breakout Node. In our example, is the Breakout Node.
- The Graph Window must be in Validation Mode
-
In the Validation Mode
F5, selectMain Menu > Analysis > Visual > Segment > Multi-Quadrant.
In previous versions of BayesiaLab, the Multi-Quadrant Analysis was available in the Tools menu.
Options
In the following panel, you can define the parameters of the Multi-Quadrant Analysis.
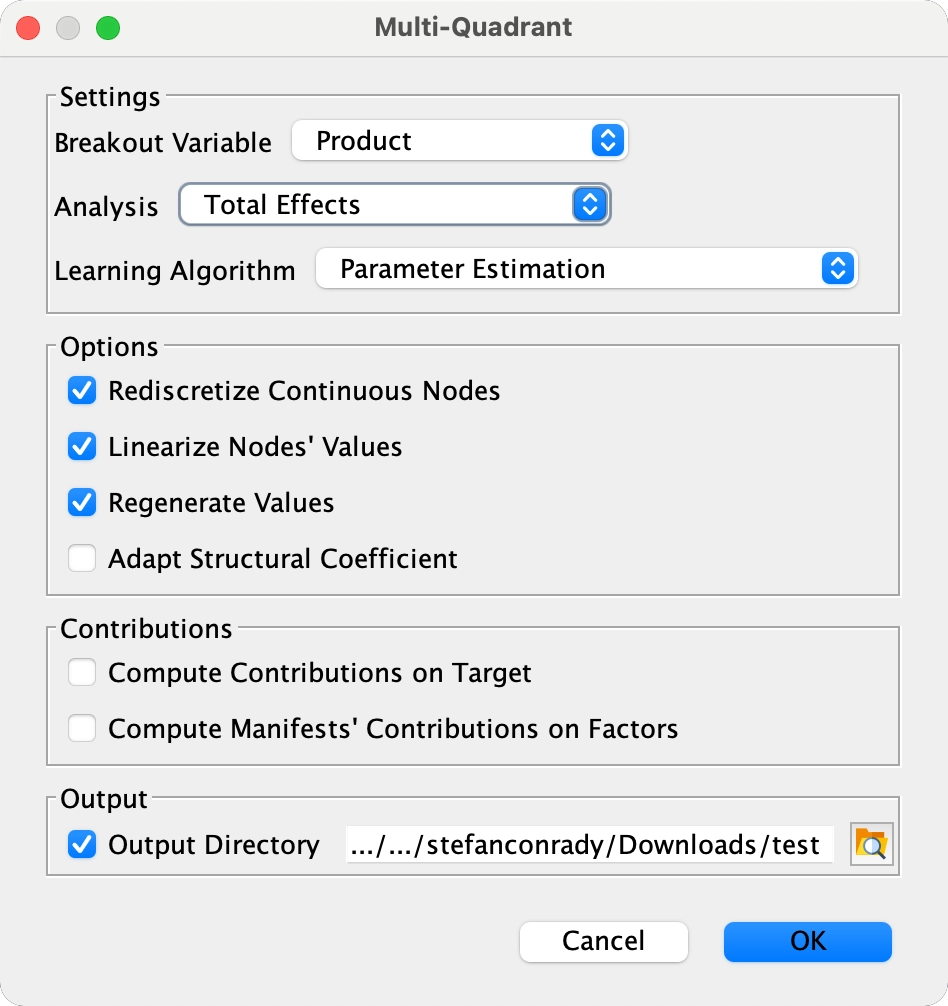
Breakout Variable
From a dropdown list showing available nodes, you can choose the node you want to use as a Breakout Node. The Target Node is always excluded from the list.
Analysis
Under Analysis, you can select the type of metric to compute for each Driver Node with regard to the Target Node:
- Mutual Information: compute the conditional Mutual Information between each variable and the target.
- Total Effects: compute the Total Effects of each node on the Target Node.
- Standardized Total Effects: compute the Standardized Total Effects of each node on the Target Node.
Linearize Nodes’ Values
By checking this option, the values associated with states of nodes are recomputed and sorted in order to have a positive increasing impact on the value of the Target Node.
Regenerate Values
By checking this option, the values associated with states of Continuous Nodes are recomputed from each subset of data. If linearization is requested, it is performed after regenerating the values.
Output Directory
You can specify the directory in which all newly-generated networks — one for each state of the Breakout Node — can be saved. Note that saving the network files is optional.
Results
For each state of the Breakout Node , the Multi-Quadrant Analysis learns or estimates a new network based on an associated dataset only containing observations that match the state of the Breakout Node. Thus, we obtain one network per state, i.e., one for each perfume brand.
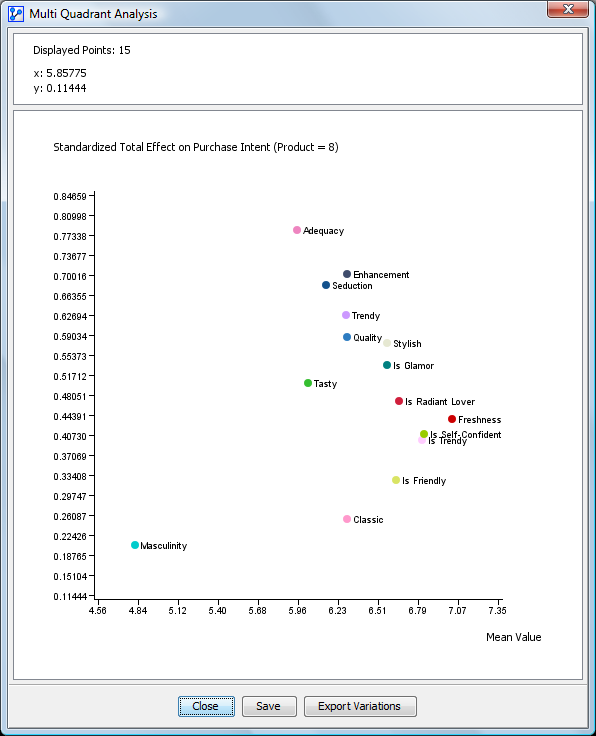
The results are combined and displayed in a single chart:
- Each point on the chart represents a Driver Node.
- The mean value of each Driver Node is displayed along the x-axis and the result of the selected analysis, e.g., the Total Effect on the Target Node, along the y-axis.
- If a Driver Node was assigned a color in the original network, the point will be displayed in that color.
- The name of each Driver Node is displayed to the right of each point.
- When hovering with your cursor over a point, the coordinates are displayed in the top panel. The top panel shows the number of points displayed and any evidence context.
- The title of the chart indicates the analysis type performed and the current state of the Breakout Node.
Chart Context Menu
- Display the Long Names of the nodes instead of their names
- Display the Long Names of the states
- Display the horizontal and vertical ranges of values
- Select the state of the Breakout Node, for which the points should be displayed. In our case, this means we can select the perfume brand to display.
- Copy the chart as an image (bitmap or vector) or copy the chart’s x-y value pairs as a data table (plain text or formatted HTML).
- Print the chart.
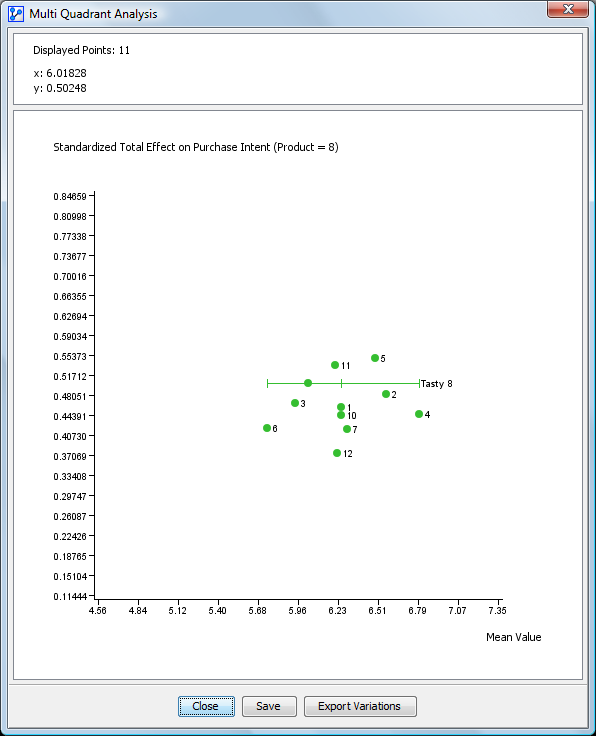
Chart Actions
- If you move your cursor over a particular point on the chart, all other displayed points disappear, and only the points for the Driver Node “Tasty” remain.
- In the example, the Driver Node is “Tasty” for state #8 of the Breakout Node . This reveals the calculated values for “Tasty” for perfume brand #8.
- Additionally, we can see the “Tasty” values for all other states of , i.e., we can see the Driver Nodes for all perfume brands simultaneously. We can now compare the relative positions of the Driver Node “Tasty.”

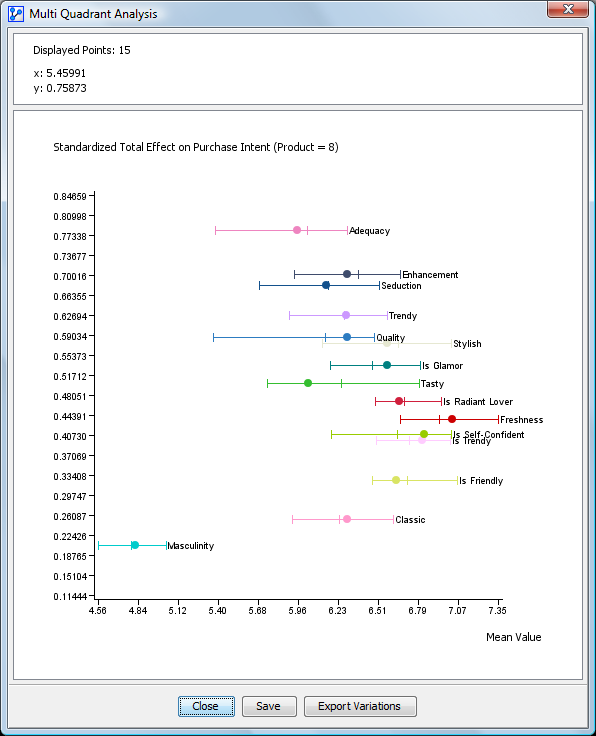
- Show Horizontal Scales and Show Vertical Scales visualize the range of the x and y-values for each Driver Node across all states of . This enables us to see the relative position of the perfume brand of interest, e.g., , relative to the other perfume brands.
- A short tick mark on the scales indicates the respective mean value for a Driver Node across all states of the Breakout Node. Therefore, we can easily identify whether “our” perfume brand performs above or below average. Furthermore, we can identify the gaps to the “best” and “worst” level for each Driver Node.
The button Export Ranges allows you to export the value ranges for each Driver Node and save them to a text file.
These ranges can be used in the context of optimization, e.g., as constraints in Target Dynamic Profile.
Quadrant Interpretation
For a more detailed explanation of how to interpret the quadrants of the Chart, please see Quadrant Interpretation, which is part of the Target Analysis Report.