Structure Comparison
Context
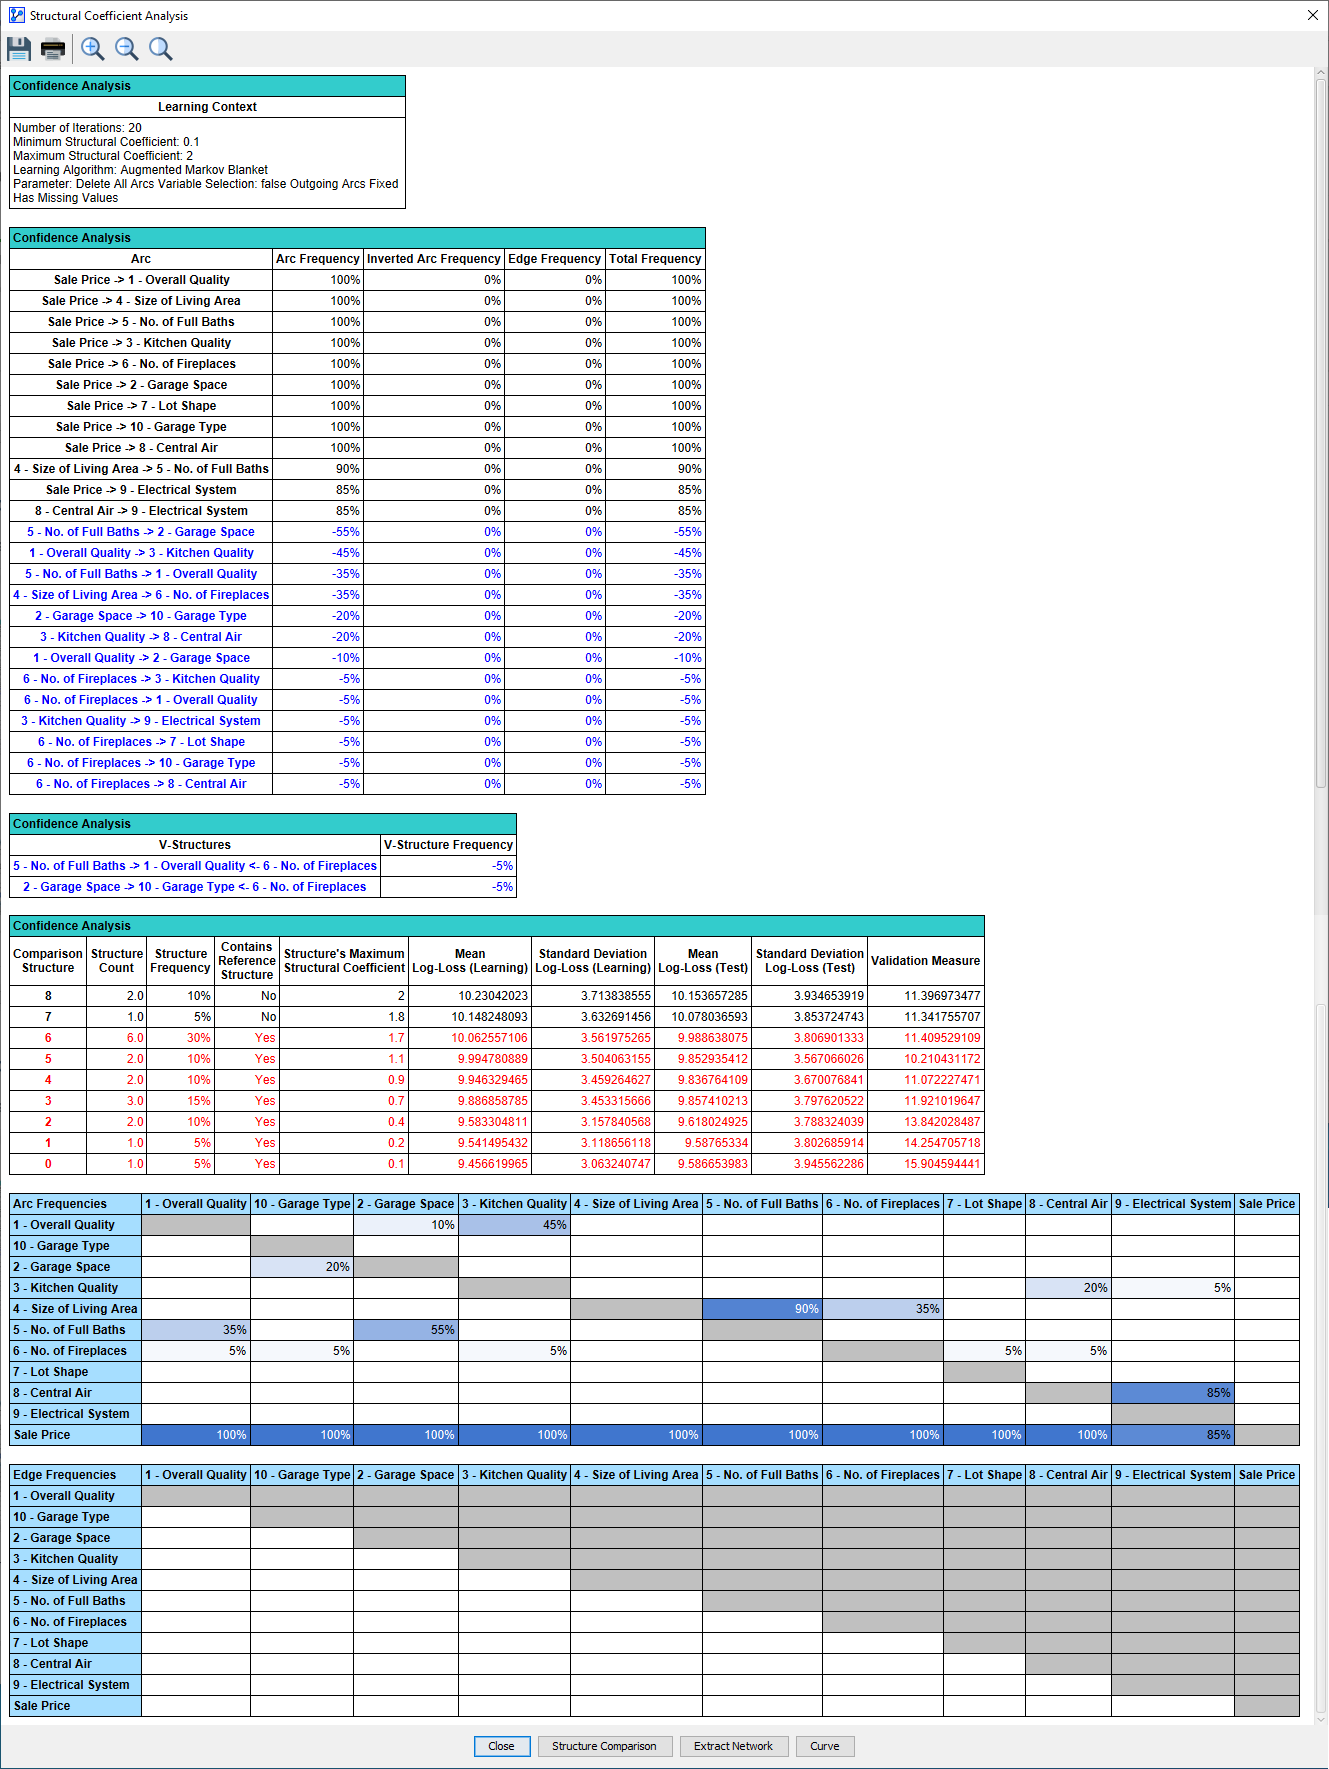
- The Structure Comparison window is a key element of the Structural Coefficient Analysis, from where it can be launched.
Usage
-
You can open the Structure Comparison window by clicking the Structure Comparison button at the bottom of the Structural Coefficient Analysis Report.
Structure Comparison Window
- The Structure Comparison window is not exclusive to the Structural Coefficient Analysis. It is also available, in similar form, in the context of other learning processes that produce multiple Bayesian networks for comparison and evaluation purposes.
- The Structure Comparison window features a toolbar at the top. Some of the icons are common throughout BayesiaLab and others are specific to this particular context:
Save the currently displayed graph as an image file | |
Print the currently displayed graph | |
Show the Synthesis Structure | |
Show the Reference Structure | |
| Go to the previous structure | |
| Go to the next structure | |
| Zoom In | |
| Zoom Out | |
Return to the Default Zoom Level | |
Resize the graph to fit the window | |
Position the graph at the top-left corner of the window | |
Stretch the graph or the selected nodes | |
Shrink the graph or the selected nodes | |
| Rotate Left | |
| Rotate Right | |
Save the currently displayed network as an XBL file | |
Open the currently displayed network in a new Graph Window |
Synthesis Structure
-
Upon opening the Structure Comparison window, the Synthesis Structure appears as the default view.
-
The Synthesis Structure is marked by the icon in the toolbar and also labeled as such at the bottom of the Structure Comparison window.
-
Although the Synthesis Structure may look like a Bayesian network, it is actually not a Bayesian network.
-
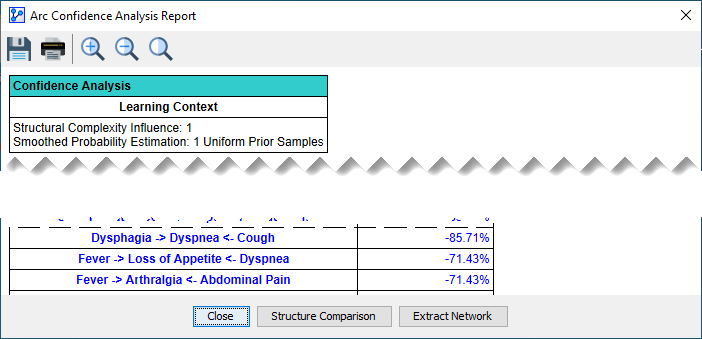
Rather, the Synthesis Structure visualizes the commonalities and differences between the Reference Network and the Comparison Networks.
- A black edge or arc signifies that it exists both in the Reference Network and all Comparison Networks.
- A blue edge or arc indicates that it does not exist in the Reference Network but does exist in at least one of the Comparison Networks.
- A red edge or arc means that it does exist in the Reference Network but does not exist in any of the Comparison Networks.
-
Arcs are displayed in the form of an arrow, while edges are shown as a straight solid line.
-
A circled line between two arcs highlights a V-structure.
-
The thickness of a line between two nodes is proportional to the frequency of the corresponding edge or arc, i.e., a thick blue arc implies that the arc occurs frequently in the Comparison Networks.
-
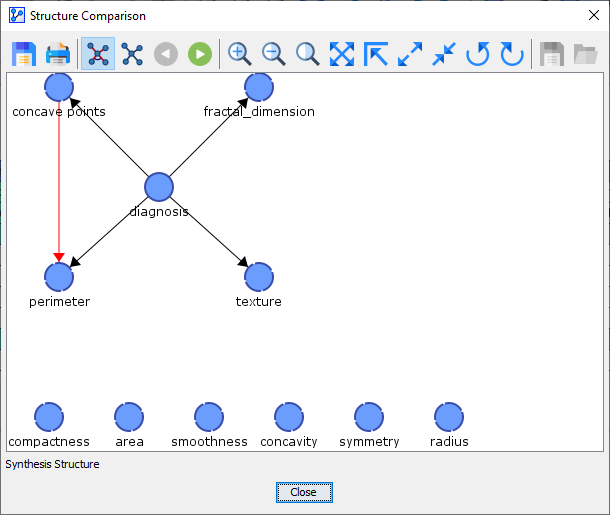
By hovering over an arc or an edge in the Synthesis Structure, tooltips provide you with details regarding the object properties, as illustrated below.
- Examples from the Synthesis Structure:
- 5 - No. of Full Baths -> 2 - Garage Space
- ”->” between the node names means that the link, whenever it is present in any structure, is always a directed arc from 5 - No. of Full Baths to 2 - Garage Space.
- “Added” means that this link does not exist in the Reference Structure but in at least one of the Comparison Structures.
- “Arc Frequency -55%” means that in 11 out of 20 Comparison Structures, the link was a directed arc from 5 - No. of Full Baths to 2 - Garage Space.
- “Inverted Arc Frequency 0%” means that none of the Comparison Structures contained the inverted arc, i.e., 2 - Garage Space to 5 - No. of Full Baths.
- “Edge Frequency 0%” means that in none of the Comparison Structures, there was an undirected edge between 5 - No. of Full Baths and 2 - Garage Space.
- Sale Price -> 6 - No. of Fireplaces
- ”->” between the node names means that the link, whenever it is present in any structure, is always a directed arc from Sale Price to 6 - No. of Fireplaces.
- “Existing” means that this link exists in the Reference Structure and all the Comparison Structures.
- “Arc Frequency 100%” means that in all 20 Comparison Structures, the link was a directed arc from Sale Price to 6 - No. of Fireplaces.
- “Inverted Arc Frequency 0%” means that none of the Comparison Structures contained the inverted arc, i.e., 6 - No. of Fireplaces to Sale Price.
- “Edge Frequency 0%” means that in none of the Comparison Structures, there was an undirected edge between Sale Price and 6 - No. of Fireplaces.
- 5 - No. of Full Baths -> 1 - Overall Quality
- ”->” between the node names means that the link, whenever it is present in any structure, is always a directed arc from 5 - No. of Full Baths to 1 - Overall Quality.
- “Added” means that this link does not exist in the Reference Structure but in at least one of the Comparison Structures.
- “Arc Frequency -35%” means that in 7 out of 20 Comparison Structures, the link was a directed arc from 5 - No. of Full Baths to 1 - Overall Quality.
- “Inverted Arc Frequency 0%” means that none of the Comparison Structures contained the inverted arc, i.e., 1 - Overall Quality to 5 - No. of Full Baths.
- “Edge Frequency 0%” means that in none of the Comparison Structures, there was an undirected edge between 5 - No. of Full Baths and 1 - Overall Quality.
- 5 - No. of Full Baths -> 2 - Garage Space
- Examples from the Synthesis Structure:
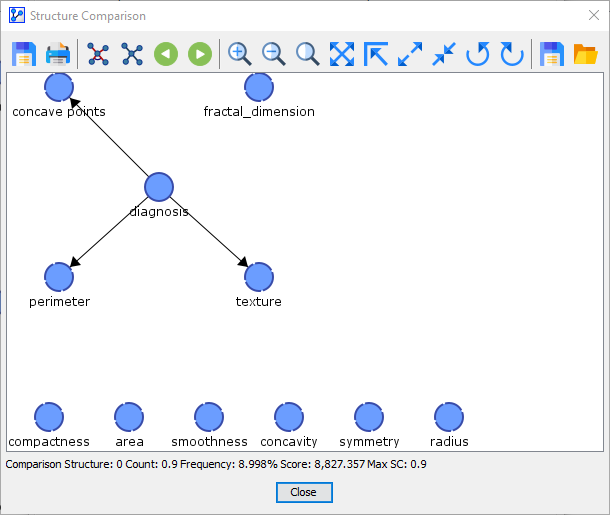
Reference Structure
-
By clicking the next button, you proceed from the Synthesis Structure to the Reference Structure.
-
Alternatively, you can access the Reference Structure by clicking the corresponding icon.
-
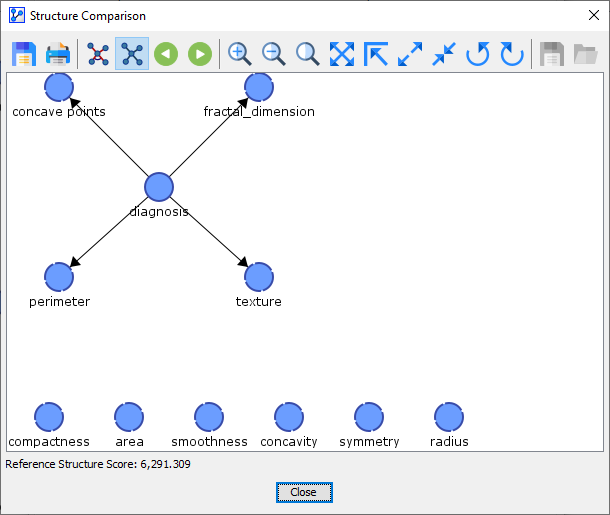
The Reference Structure represents the original network. Thus, what is displayed is a proper Bayesian network, not merely an illustration.
Comparison Structures
-
By clicking the next button, you proceed from the Reference Structure to the first of potentially many Comparison Structures.
-
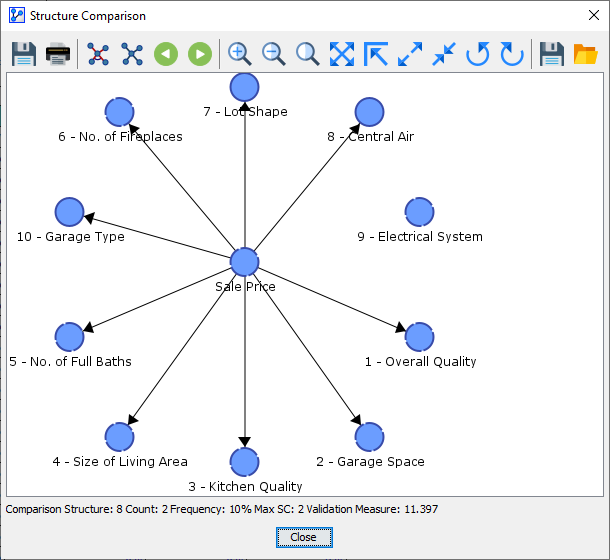
The first one is labeled as “Comparison Structure: 8” at the bottom of the window.
-
You can use the previous and next buttons to navigate through the available structures in this order:
- Synthesis Structure, i.e., the illustration of the differences between the Reference Network and the Comparison Networks.
- Reference Structure, i.e., the starting point of the analysis that produced all Comparison Networks.
- Comparison Structure 8
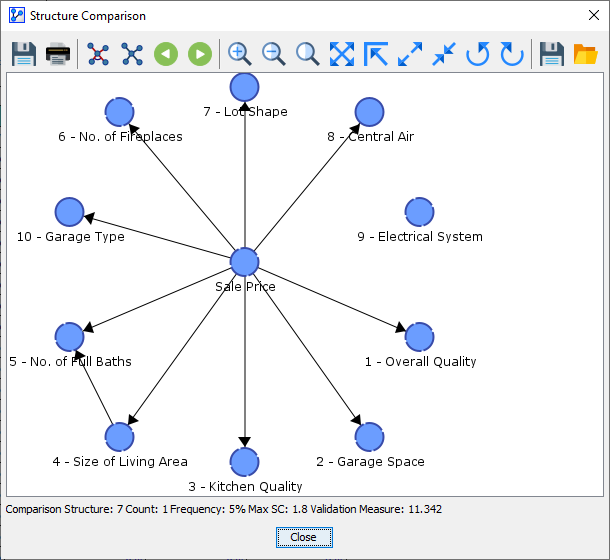
- Comparison Structure 7
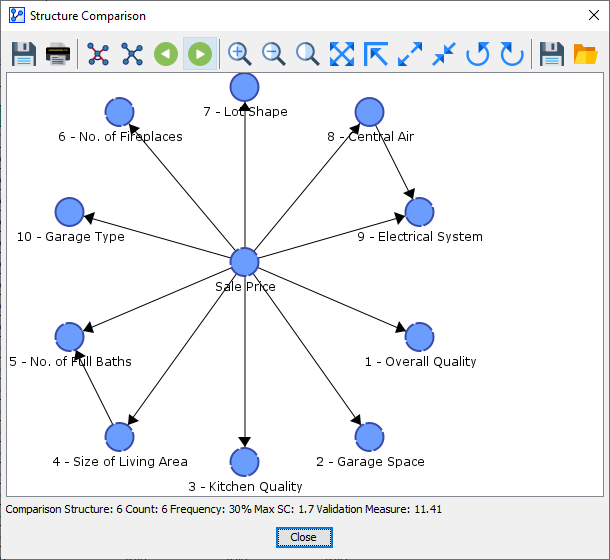
- Comparison Structure 6
- etc.
-
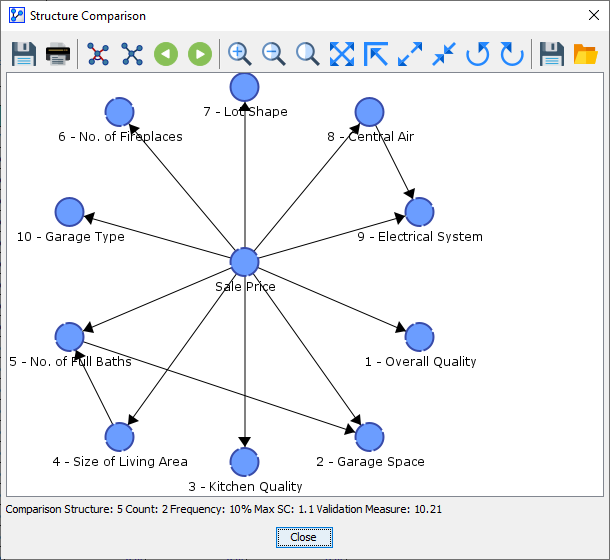
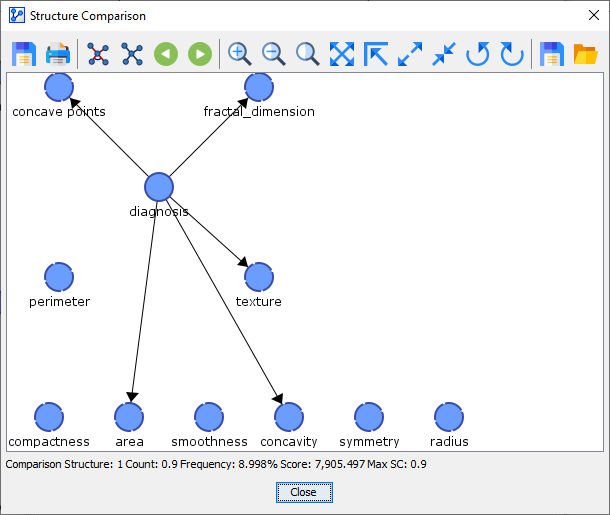
Right underneath the graph area, BayesiaLab reports additional information regarding the displayed Comparison Structure:
- The sequence number, e.g., 8, 7, … 0.
- The Count, i.e., the number of times the displayed Comparison Structure was found. In the above screenshot, the shown Comparison Structure was found twice.
- The Frequency, which refers to the count of the displayed Comparison Structures divided by the count of all generated Comparison Structures. Here, the Frequency is 10% (=2/20 displayed in percent). Note that the total number of Comparison Structures is not displayed here.
- The Max SC, which represents the Structural Coefficient used for learning the displayed Comparison Structure.
- The Validation Measure, which serves as a quality measure for choosing an appropriate Structural Coefficient.
-
For Comparison Structures, the Save Network and Open Network icons are available. This allows you to extract the currently displayed Comparison Structure.
-
The following table provides a side-by-side comparison of all structures. Click on the thumbnails to see full-size screenshots.
| Synthesis Structure | Reference Structure | Comparison Structure 8 | Comparison Structure 7 | Comparison Structure 6 | Comparison Structure 5 | Comparison Structure 4 | Comparison Structure 3 | Comparison Structure 2 | Comparison Structure 1 | Comparison Structure 0 |
| | |  |  |  |  |  |  |  |  |
| Count: 2 | Count: 1 | Count: 6 | Count: 2 | Count: 2 | Count: 3 | Count: 2 | Count: 1 | Count: 1 | ||
| Frequency: 10% | Frequency: 5% | Frequency: 30% | Frequency: 10% | Frequency: 10% | Frequency: 15% | Frequency: 10% | Frequency: 5% | Frequency: 5% | ||
| Max. SC: 2 | Max. SC: 1.8 | Max. SC: 1.7 | Max. SC: 1.1 | Max. SC: 0.9 | Max. SC: 0.7 | Max. SC: 0.4 | Max. SC: 0.2 | Max. SC: 0.1 | ||
| Validation Measure: 11.397 | Validation Measure: 11.342 | Validation Measure: 11.41 | Validation Measure: 10.21 | Validation Measure: 11.072 | Validation Measure: 11.921 | Validation Measure: 13.842 | Validation Measure: 14.255 | Validation Measure: 17.056 |