Knowledge Modeling
Part of the BayesiaLab exploration path. Start with the BayesiaLab Overview.
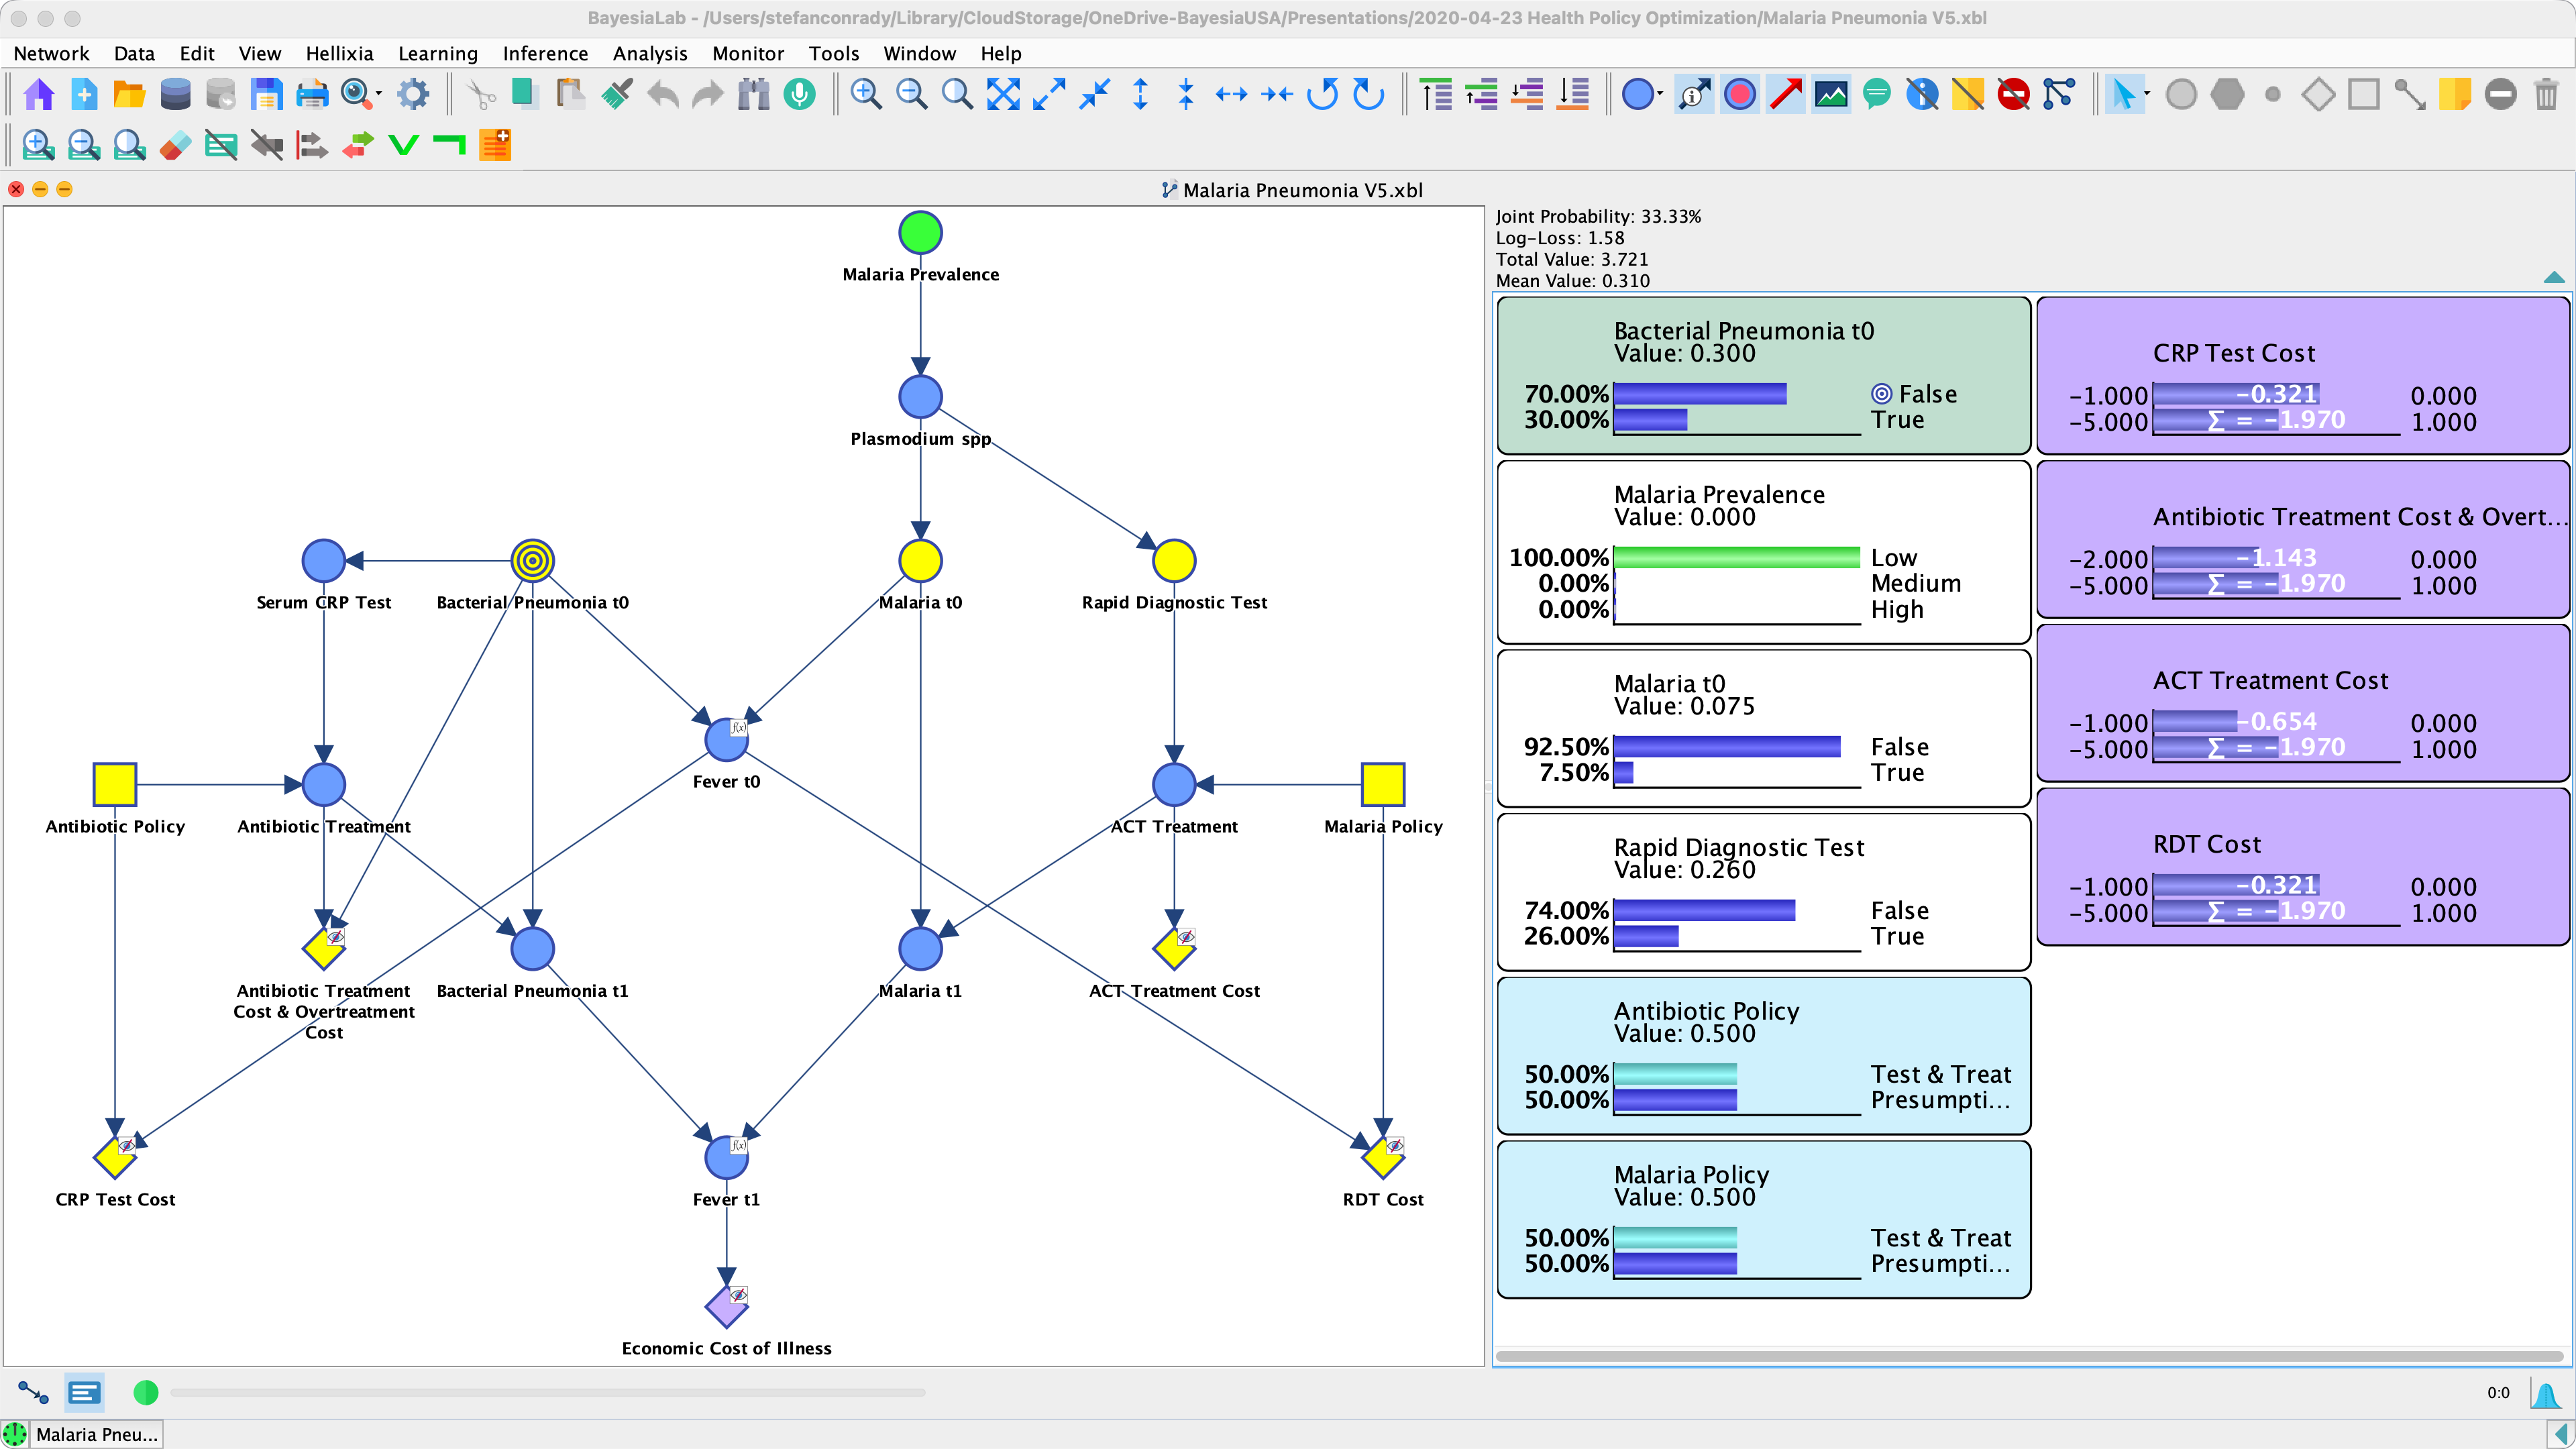
BayesiaLab allows subject-matter experts to encode causal and probabilistic domain knowledge directly in a Bayesian network.

From Expert Reasoning to Network Structure
- Subject-matter experts often describe domains as cause-and-effect diagrams.
- BayesiaLab provides a direct analog: nodes represent variables, and arcs represent relationships.
- Nodes can be added and arranged in the Graph Panel.
- Arc orientation encodes assumed causal direction.
- Probabilistic relationships and node properties are managed in the Node Editor.
- BayesiaLab enforces internal consistency to reduce accidental modeling contradictions.
Knowledge Elicitation with BEKEE
- Beyond direct manual modeling, BayesiaLab supports expert elicitation through the Bayesia Expert Knowledge Elicitation Environment (BEKEE).
- BEKEE is a web service for systematically acquiring explicit and tacit knowledge from multiple experts.
Discrete, Nonlinear, and Nonparametric Representation
- BayesiaLab represents probabilistic relationships through Conditional Probability Tables (CPT), without assuming fixed functional forms.
- This discrete, nonparametric representation naturally supports nonlinear effects.
- Continuous variables can be discretized manually or automatically via tools in the Data Import Wizard, Node Editor, and standalone discretization workflows.