Relationship Analysis Report
Context
- Relationship Analysis produces a comprehensive report containing information-theoretic and statistical measures computed from the given Bayesian network.
- While many of these measures are available individually in other reports and visualizations, this report compiles all of them into concise tables.
Usage
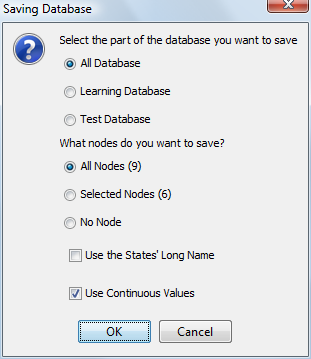
- Highlight the arcs to analyze. If none are selected, the analysis will be performed on all arcs in the network.
- To launch the Relationship Analysis, select
Main Menu > Analysis > Report > Relationship. - Alternatively, use the shortcut Ctrl + R to launch the report.
- The analysis process can be stopped at any time. In that case, the report will include only the measures computed up to that point.
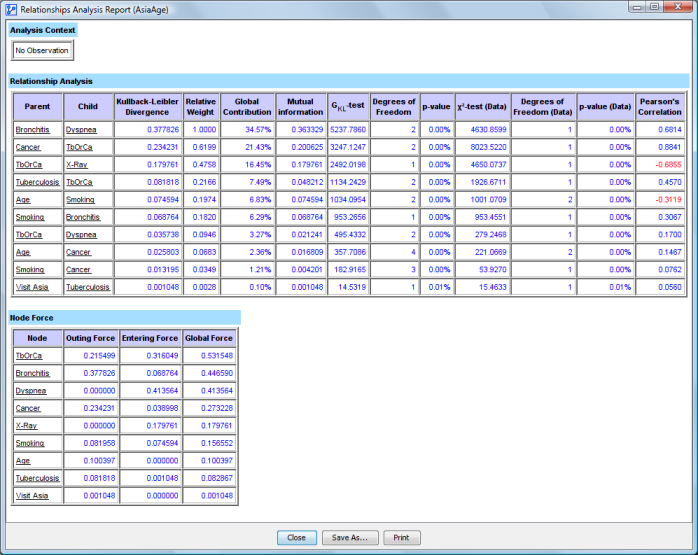
- The Relationship Analysis report opens in a new window, containing four tables.
Interpretation
Analysis Context
- The Analysis Context table lists any evidence set when running the report along with its Joint Probability.
- If no evidence is set, the Analysis Context displays No Observation.
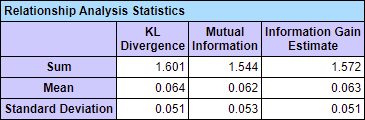
Relationship Analysis Statistics
- The Relationship Analysis Statistics table reports the sum, mean, and standard deviation for:
Relationship Analysis Table
- Covers all selected arcs, i.e., all corresponding parent-child relationships.
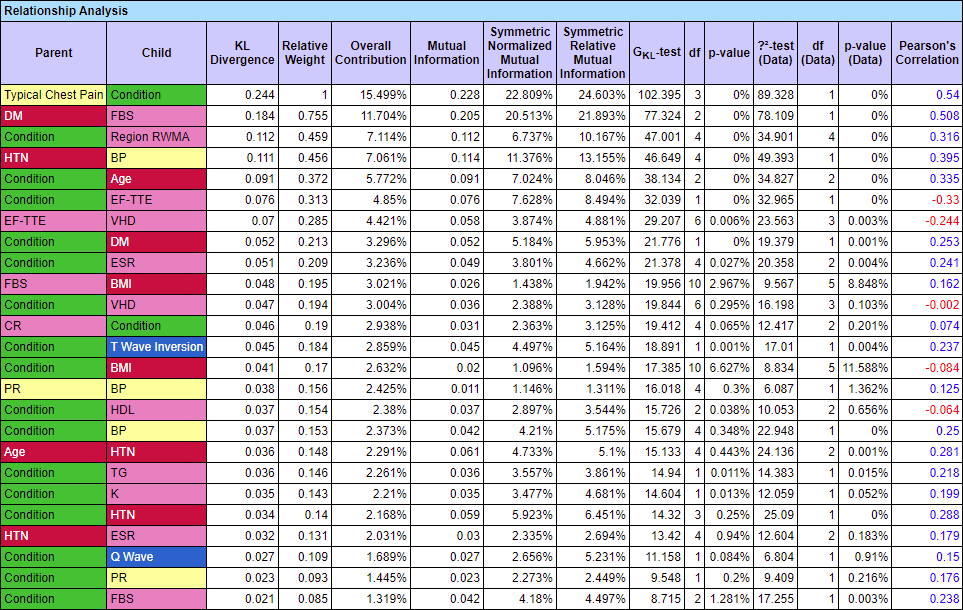
- Key Columns:
- Parent and Child Nodes: Background colors match assigned node colors in the network.
- KL Divergence: Kullback-Leibler Divergence for all selected arcs, listed in descending order.
- Relative Weight: Top row is set to 1, with subsequent rows shown as a fraction of the top row.
- Global Contribution: Fraction of the KL Divergence of a row compared to the total KL Divergence across all rows.
- Mutual Information: Information shared between variables.
- GKL-test: Independence test based on KL Divergence, accounting for filtered states.
- Degrees of Freedom: Used to compute independence probability.
- p-value: Independence probability for the GKL-test.
- Chi2-test/G-test on Data: If data is associated, independence tests are computed from the data.
- Pearson Correlation: Pearson’s Correlation coefficient for each arc.
Node Force Table
- Represents Node Force Analysis:
- Outgoing Force: Sum of forces from outgoing arcs.
- Entering Force: Sum of forces from incoming arcs.
- Global Force: Combined sum of entering and outgoing arc forces.