Confidence Analysis Report
Context
- Upon completing the learning process that was launched as part of the Structural Coefficient Analysis, the results are automatically presented in a Confidence Analysis Report, which opens in a new window.
Confidence Analysis Report
-
The following screenshot presents the entire Confidence Analysis Report. Click on the thumbnail image to see the report in its original size.
-
Next, we discuss each element of the report individually.
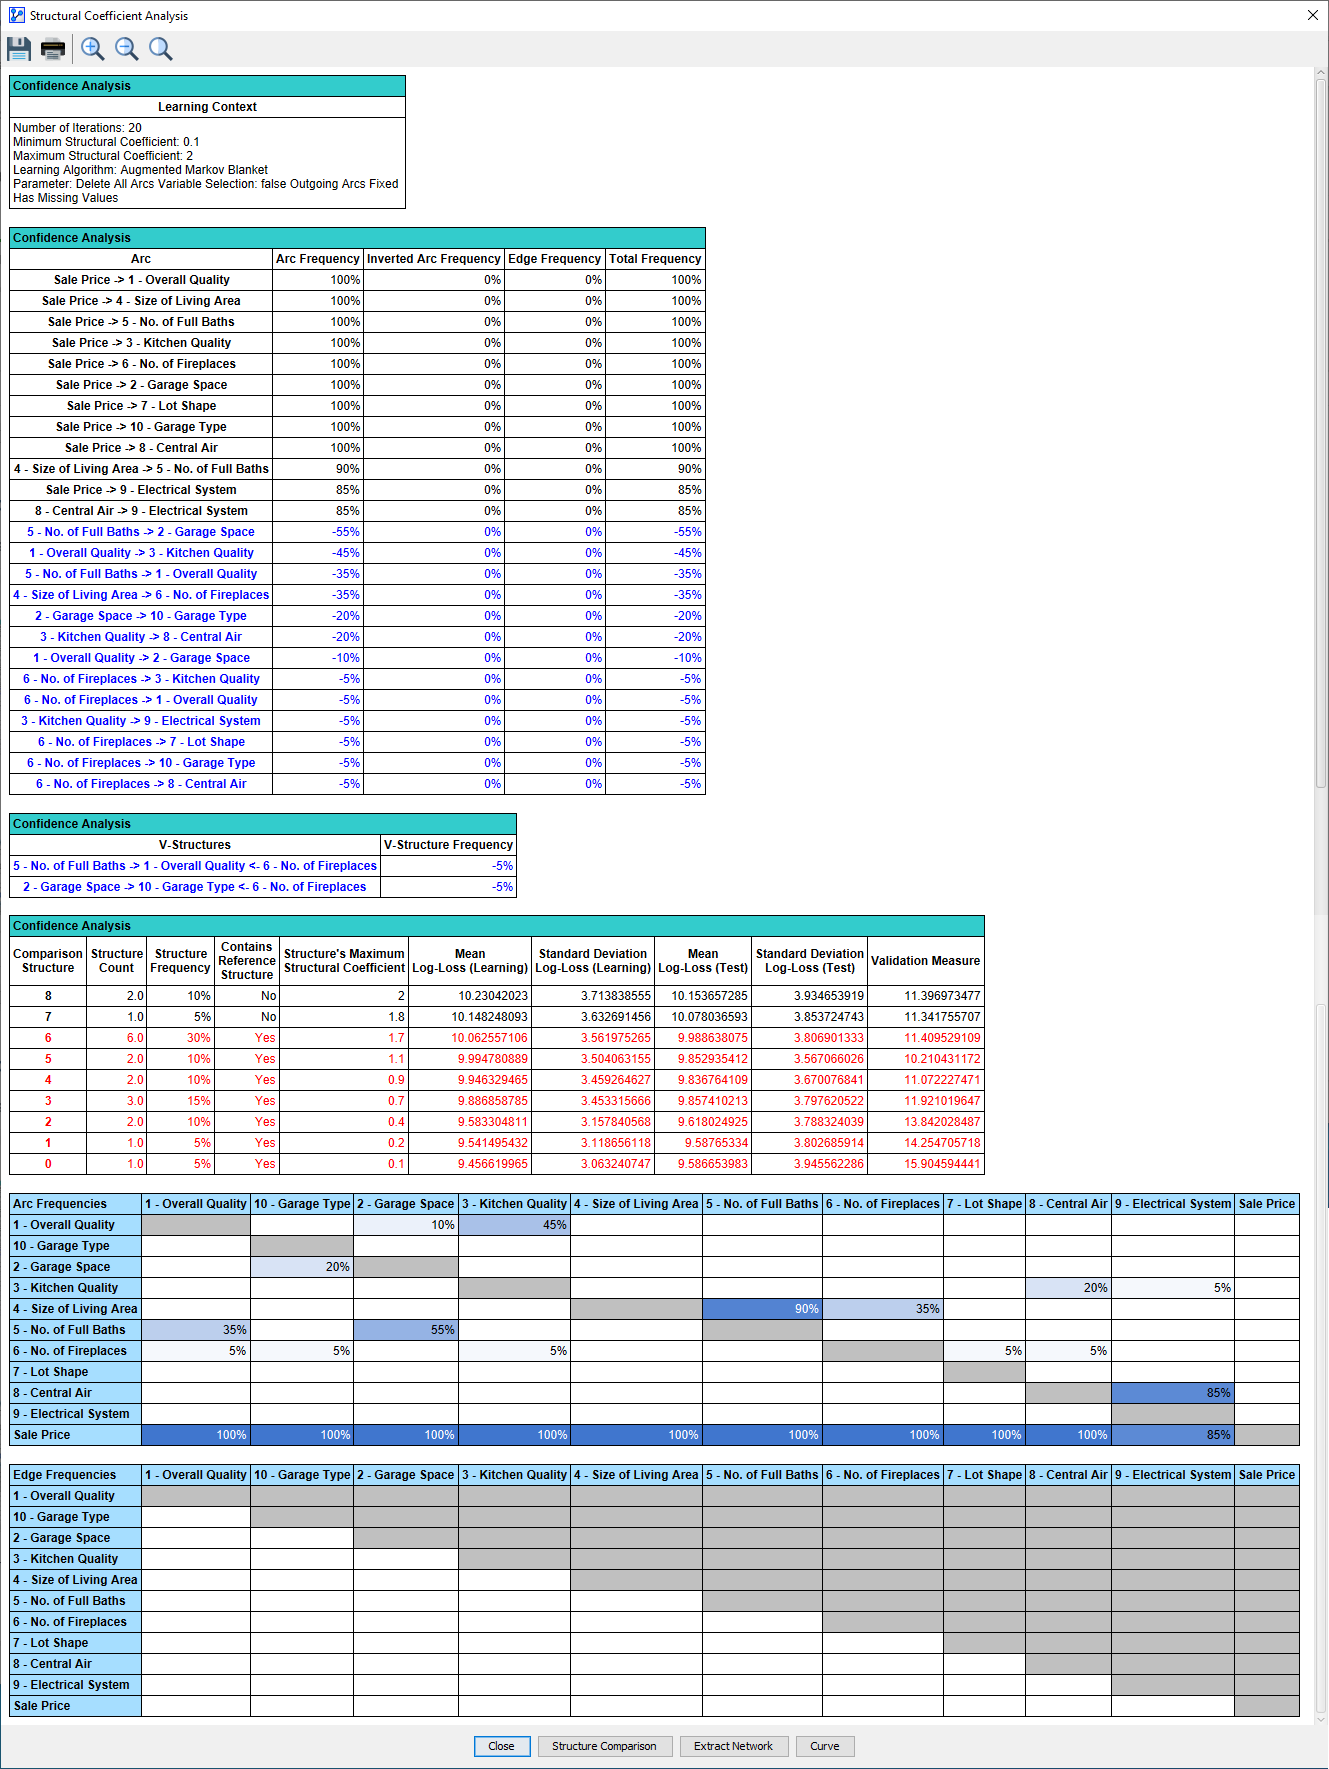
Learning Context
-
The Learning Context summarizes what you specified at the beginning of the analysis.
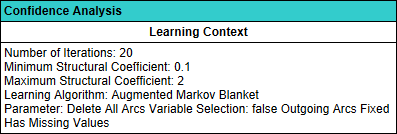
Arc Frequency
-
The next section of the report deals with how frequently arcs and edges are found across all learning iterations, i.e., how often they appear in the Comparison Structures.
-
The arcs listed in black were in the Reference Structure, i.e., the network from which the Structural Coefficient Analysis was started.
-
The columns display how often the listed arcs and edges were found across all Comparison Structures.
-
Rows in black indicate that the corresponding arcs are part of the original Reference Structure.
-
Rows highlighted in blue indicate that these arcs and edges are found in addition to the ones already in the Reference Structure. The negative sign emphasizes that these arcs and edges are not present in the Reference Structure.
-
Rows in red indicate that the arcs or edges are present in the Reference Structure, but were removed in all Comparison Structures. Note that there is no such row in this report.
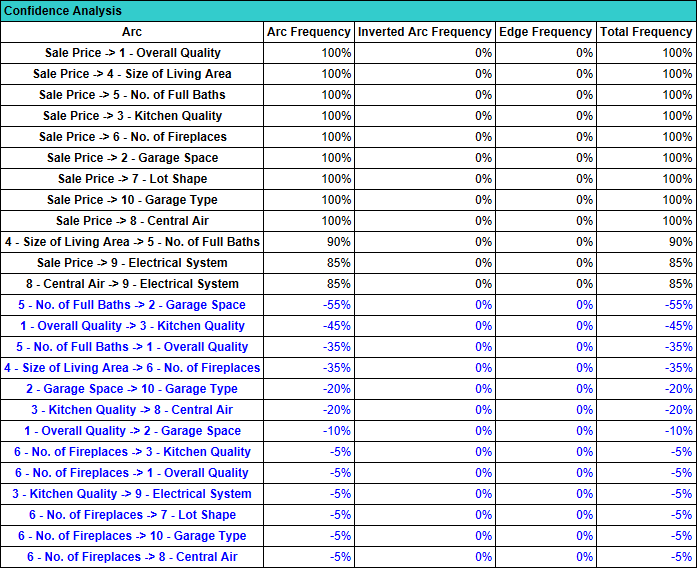
V-Structure Frequency
-
This section refers to the frequency of V-Structures added in the Comparison Structures.
-
The color coding for the V-Structures is the same as for the arcs and edges in the Arc Frequency section of the report.
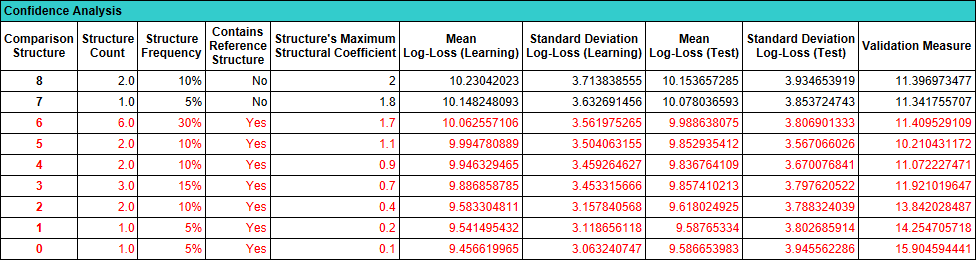
Comparison Structures
-
The next report section lists all Comparison Structures generated by evaluating the range of Structural Coefficient values. For an associated dataset that does not have a Learning/Test Set split, the last three columns to the right would be omitted from the table.
-
Note that this table does not have 20 rows, as you may have expected. Rather, it lists all the unique Comparison Structures found.
-
In the table, there are 9 Comparison Structures, 0 through 8. This means that the same Comparison Structure was found for several different values of the Structural Coefficient.
-
For instance, Comparison Structure 4 was found twice, which is reported in the Structure Count column.
-
The Structure Frequency column translates the Structure Count of 2 into a percentage, i.e., 10% (2 out of 20 Comparison Structures).
-
The column Contains Reference Structure indicates whether the arcs of the Reference Structure are a subset of the arcs of the Comparison Structure.
-
Furthermore, the rows of those Comparison Structures that do contain the Reference Structure are highlighted in red.
-
The Structure’s Maximum Structural Coefficient relates to the fact that the same Comparison Structure can be found at multiple levels of the Structural Coefficient, e.g., the Comparison Structure 4 is generated with SC=0.8 and SC=0.9. In such a case, the report only shows the maximum Structural Coefficient value, i.e., 0.9.
Log-Loss and Validation Measures
-
All items in the report so far dealt with structure, i.e., the presence and absence of arcs.
-
Now, the Log-Loss measures take into account the fit of each Comparison Structure to the associated dataset.
-
Given that the dataset of this example is split into a Learning Set and Test Set, the measures are reported separately for each set:
- Mean Log-Loss (Learning)
- Standard Deviation Log-Loss (Learning)
- Mean Log-Loss (Test)
- Standard Deviation Log-Loss (Test)
-
Regardless of whether the Structural Coefficient Analysis is performed in the context of Supervised or Unsupervised Learning, the Log-Loss measures here quantify the fit of all nodes to the data.
-
As such, the Log-Loss measures reported here are equivalent to what the Overall Network Performance analysis would compute.
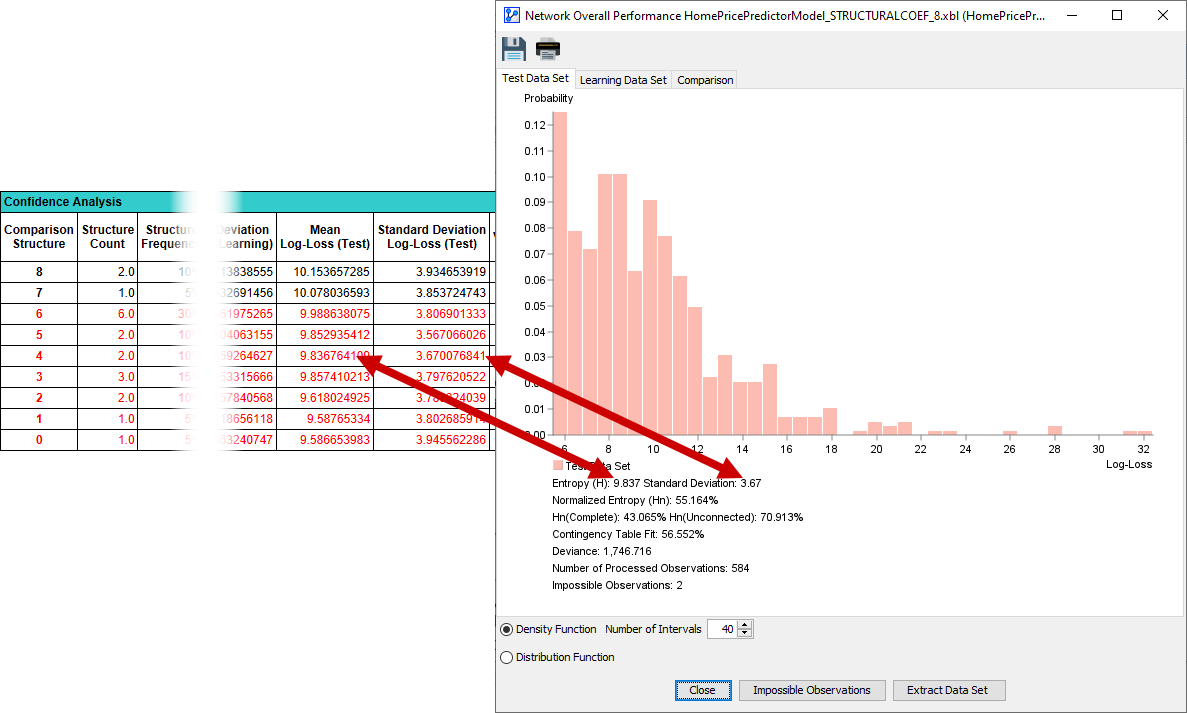
-
The following screenshot juxtaposes the report from this Structural Coefficient Analysis with the Overall Network Performance Report of Comparison Structure 4, which we performed separately for illustration purposes:
-
For a detailed discussion of Log-Loss as a performance measure, please see Overall Network Performance: Report for Learning and Test Set.
Validation Measure
-
The final column in the report shows the Validation Measure of each Comparison Structure.
-
Note that the Validation Measure can only be computed on the basis of a Learning/Test Set split.
-
The Validation Measure VM is defined as
where LL stands for Log-Loss.
-
As with all measures provided in the context of the Structural Coefficient Analysis, the Validation Measure is meant to support you in choosing an appropriate value for the Structural Coefficient.
-
For a more detailed discussion of the meaning and the interpretation, please see the Validation Measure page.
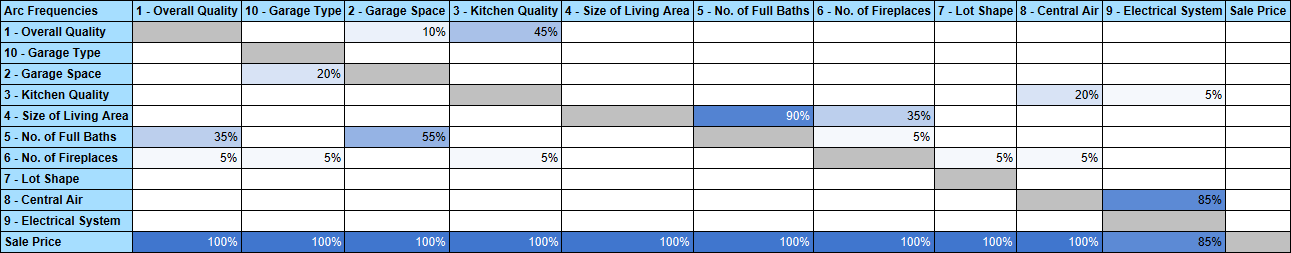
Arc Frequencies
-
The Arc Frequencies Table shows how often a particular arc was found in all of the Comparison Structures learned during Structural Coefficient Analysis. The column on the left refers to the arc origin (i.e., the parent node) and the row across the top of the table refers to the arc destination (i.e., the child node).
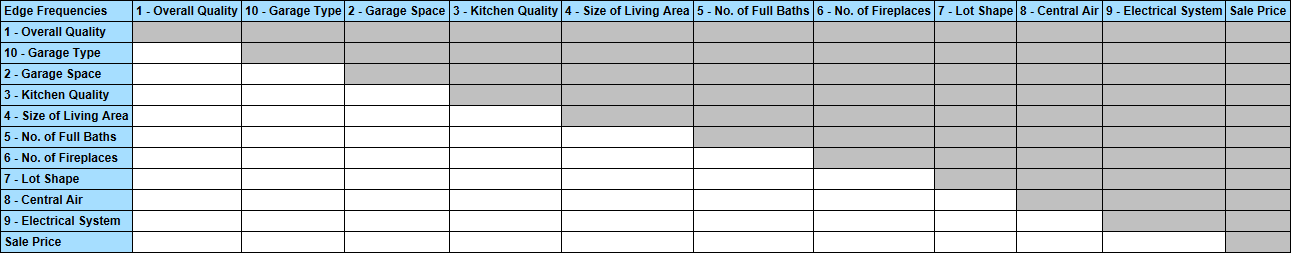
Edge Frequencies
-
The Edge Frequencies Table shows how often a particular edge was found in all of the Comparison Structures learned during Structural Coefficient Analysis. As edges are undirected, there is no distinction between origin and destination, so all cells above the diagonal are grayed out.
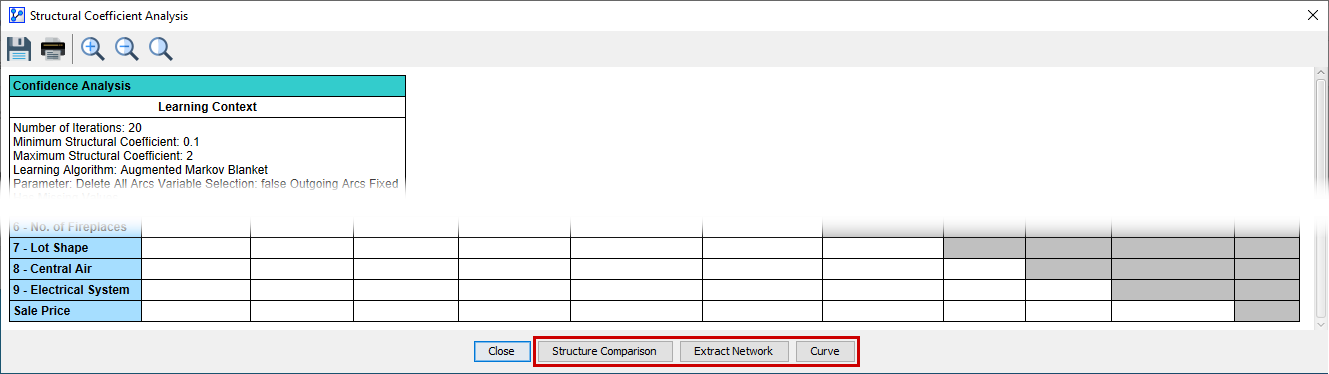
Structure Comparison, Extract Network, and Curve
-
The Confidence Analysis Report is merely a starting point for an in-depth analysis of the generated Comparison Structures.
-
At the bottom of the Confidence Analysis Report, three additional functions are available via the buttons shown above.
-
Follow the above links to learn about these important tools.