Occurrence Matrix
Context
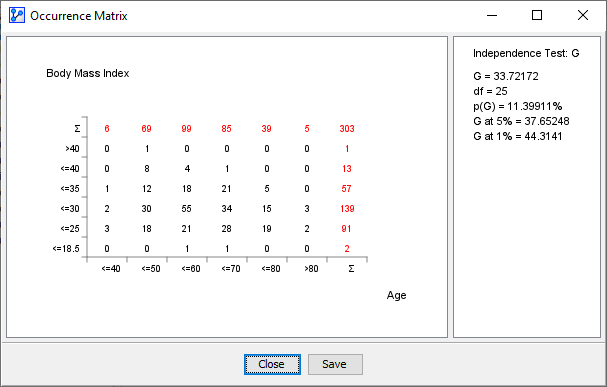
The Occurrence Matrix graph displays a two-dimensional table of the selected variables plus the statistics of the corresponding independence test.
Usage
- You can access the Occurrence Matrix function in multiple ways:
Main Menu > Data > Charts > Occurrence Matrix.Node Context Menu > Charts > Occurrence Matrix.
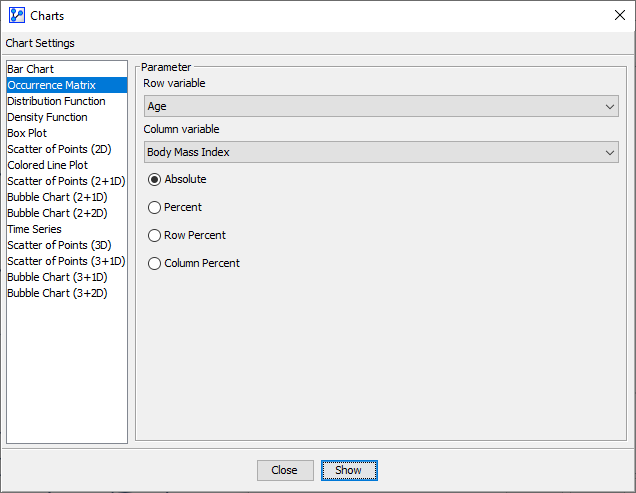
- In the Parameter panel, select any of the available variables from the dropdown lists:
- Select the Row Variable.
- Select the Column Variable.
- If you had nodes selected when you opened the Charts window, the variables in the dropdown menus are restricted to that selection.
- Check one of the following options:
- Absolute.
- Percent.
- Row Percent.
- Column Percent.
- If a learning/test split is defined, you can also specify which subset to use.
- Click
Showto produce the chart.
- The right panel contains all the information about the χ² test or G-test, plus the computed degrees of freedom.
- You can choose the type of independence test, G or χ², under
Main Menu > Window > Preferences > Tools > Statistical Tools. - Note that Missing Values are not taken into account for the independence test, but Weights are.
- You can choose the type of independence test, G or χ², under