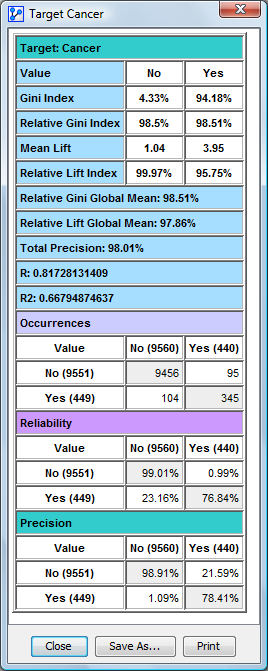
Network Performance Analysis — Target
Context
Using the associated dataset, this tool evaluates the performance of the active Bayesian network with regard to predicting the target variable.
If the associated database is split into a learning and a test set, the analysis is performed only over the test data. Otherwise, the analysis applies to the entire dataset.
If available, dataset weights are used in the evaluation.
This evaluation can be performed either with regard to one state of the target, or with regard to all states.
If the Target Node has only two states, you can specify the probability acceptance threshold. By default, a single threshold is set to 0.5.
Alternatively, we can run this analysis for multiple thresholds. In this case, we set the number of thresholds to be evaluated, and BayesiaLab will determine the appropriate probability thresholds according to an equal frequency distribution.
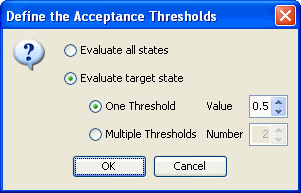
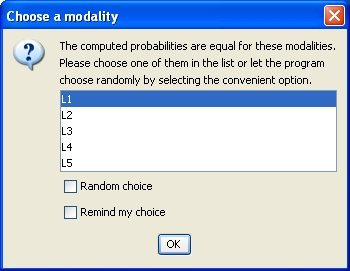
In the case of equal probabilities, you can set the choice policy in this dialog box:
For multiple-threshold analysis, the results are presented in the following format. BayesiaLab will display the confusion matrices for each threshold, as selected from the Acceptance Threshold dropdown menu.
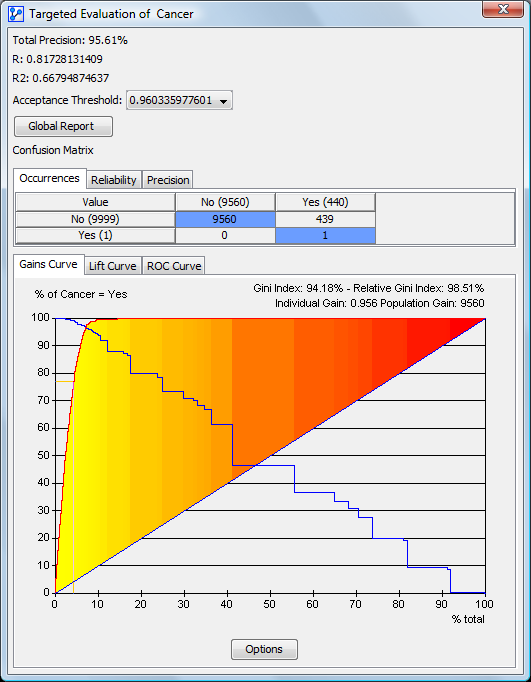
For multiple-state analysis, shown in the following report, there is one tab for each target state. The tabs contain the results curves for the respective state.
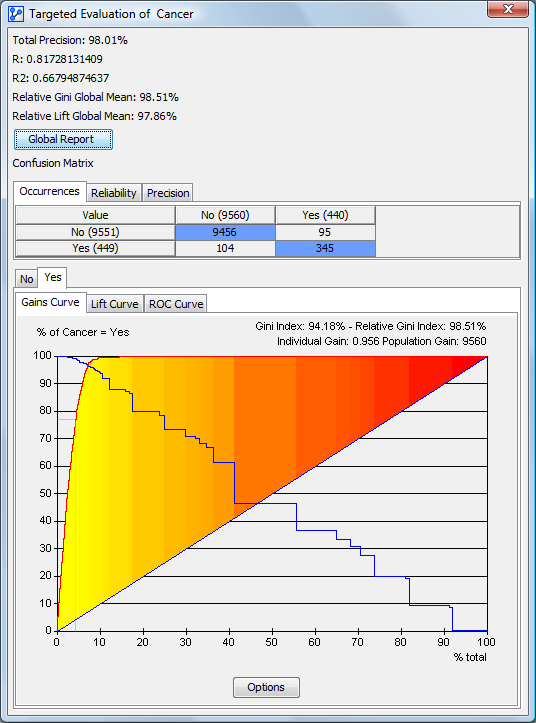
As shown in the above report window, the evaluation is performed with a number of complementary methods:
- Total Precision of the model, which is a function of the number of correct predictions of the target variable.
- Confusion Matrix, which shows the number of occurrences, plus the reliability and precision of each prediction.
- Gains Curve, the Lift Curve, and the ROC Curve, all centered on the target state.
At the top of the report window, the Total Precision of the network is shown. Right underneath, two more measures are displayed that quantify the quality of the numerical prediction:
- R: Pearson Correlation
- R2: the squared value of the Pearson Correlation
By clicking the Global Report button, BayesiaLab can generate a report that contains, for each acceptance threshold, the Total Precision and the corresponding confusion matrices.
Grouped into subsections by Target State, this report also shows:
- Gini Index
- Relative Gini Index
- Mean Lift
- Relative Lift Index.
Finally, the Relative Gini Global Mean, the Relative Lift Global Mean, the Total Precision, the Pearson Coefficient R, and its squared value, R2, are listed.
This report can be saved as a formatted HTML file, which can then be opened in a spreadsheet, for instance in Excel.
