Structural Network Comparison in Analysis Context
Context
- Structural Network Comparison is a way to compare networks in terms of their structure.
- On this page, we explain how Structural Network Comparison can be used in the context of, and at the conclusion of, certain analysis functions.
- Hence, we refer to the tool here as Structural Network Comparison in Analysis Context.
- As opposed to the Direct Structural Network Comparison, which is limited to comparing two networks, the Structural Network Comparison in Analysis Context compares all the networks produced by the preceding analysis function.
- For reference, you can access the Direct Structural Network Comparison from the Main Menu, and its usage is explained here: Direct Structural Network Comparison.
Usage
The Structural Network Comparison in Analysis Context only becomes available from within the report window of any of the following functions:
Main Menu > Tools > Multi-Run > ...Structural Coefficient AnalysisBatch Learning
Main Menu > Tools > Resampling > ...Arc Confidence > ...JackknifeBootstrapData Perturbation
Variable Clustering > ...JackknifeBootstrapData Perturbation
Target Evaluation > ...JackknifeBootstrapData PerturbationK-Fold
Multi-Target Evaluation > ...JackknifeBootstrapData PerturbationK-Fold
All these functions generate multiple networks by using variations of machine-learning algorithms, mostly for model validation purposes.
You can subsequently evaluate all generated networks on the basis of a report or the Structural Network Comparison discussed here.
On this page, we focus exclusively on the visual comparison, which is common to all of the functions above. Therefore, we do not discuss the different validation objectives that may have prompted you to use these functions.
Example
-
For illustration purposes, we show the Structural Network Comparison at the conclusion of a Batch Learning process.
-
In this example, the Batch Learning process produced a total of 7 networks that can be compared.
-
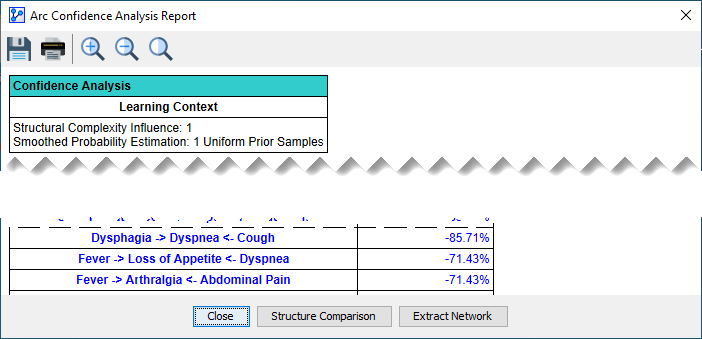
At the bottom center of the report generated by Batch Learning (and any of the other analysis functions listed above) is the Structure Comparison button:
-
Clicking the Structure Comparison button opens up the Structure Comparison Window.
Structure Comparison Window
The Structure Comparison Window features a toolbar at the top. Some of the icons are common throughout BayesiaLab and others are specific to this particular context:
Save the currently displayed graph as an image file | |
Print the currently displayed graph | |
Show the Synthesis Structure | |
Show the Reference Structure | |
Go to the previous structure | |
| Go to the next structure | |
| Zoom In | |
| Zoom Out | |
Return to the Default Zoom Level | |
Resize the graph to fit the window | |
Position the graph at the top-left corner of the window | |
Stretch the graph or the selected nodes | |
Shrink the graph or the selected nodes | |
| Rotate Left | |
| Rotate Right | |
Save the currently displayed network as an XBL file | |
Open the currently displayed network in a new Graph Window |
Synthesis Structure
-
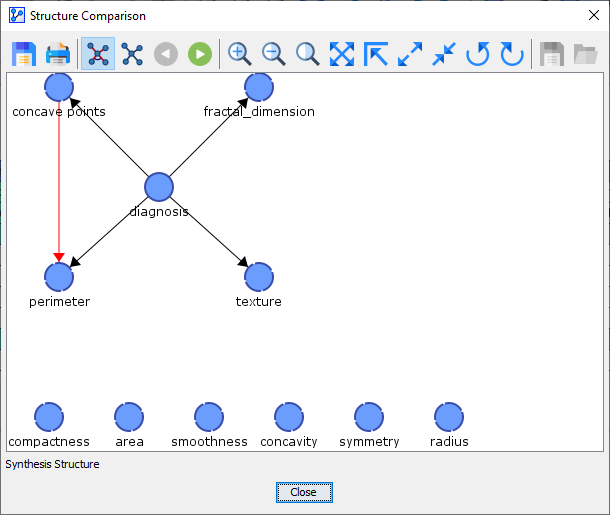
Upon opening the Structure Comparison Window, the Synthesis Structure appears as the default view.
-
The Synthesis Structure is marked by the icon in the toolbar and also labeled as such at the bottom of the Structure Comparison Window.
-
Although the Synthesis Structure may look like a Bayesian network, it is actually not a Bayesian network.
-
Rather, the Synthesis Structure visualizes the commonalities and differences between the Reference Network and the Comparison Networks.
-
A black edge or arc signifies that it exists both in the Reference Network and all Comparison Networks.
-
A blue edge or arc indicates that it does not exist in the Reference Network but that it does exist in at least one of the Comparison Networks.
-
A red edge or arc means that it does exist in the Reference Network but that it does not exist in any of the Comparison Networks.
-
-
Arcs are displayed in the form of an arrow, while edges are shown as a straight solid line.
-
A circled line between two arcs highlights a V-structure.
-
The thickness of a line between two nodes is proportional to the frequency of the corresponding edge or arc, i.e., a thick blue arc implies that the arc occurs frequently in the Comparison Networks.
-
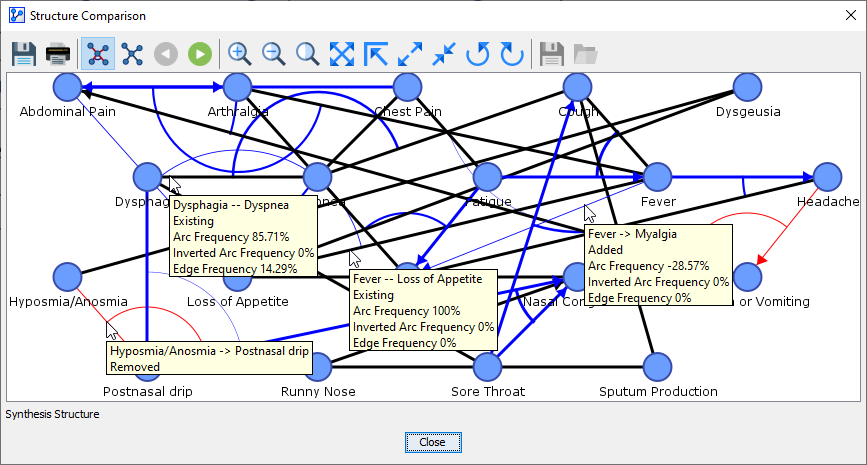
By hovering over an arc or an edge in the Synthesis Structure, tooltips provide you with details regarding the object properties, as illustrated below.
-
Examples from the Synthesis Structure:
-
Dysphagia — Dyspnea
-
”—” between the node names means the link is an undirected edge in the Reference Structure or in at least one of the Comparison Structures.
-
“Existing” means that this link exists in the Reference Structure and all the Comparison Structures.
-
“Arc Frequency 85.71%” means that in 6 out of 7 Comparison Structures, the link was a directed arc from Dysphagia to Dyspnea.
-
“Inverted Arc Frequency 0%” means that none of the Comparison Structures contained the inverted arc, i.e., Dyspnea to Dysphagia.
-
“Edge Frequency 14.29%” means that in 1 out of 7 Comparison Structures, there was an undirected edge between Dysphagia and Dyspnea.
-
-
Hyposmia/Anosmia -> Postnasal Drip
-
”->” between the node names means the link is a directed arc from Hyposmia/Anosmia to Postnasal Drip.
-
“Removed” means that this link does not exist in any of the Comparison Networks.
-
-
Fever — Loss of Appetite
-
”—” between the node names means the link is an undirected edge in the Reference Structure or in at least one of the Comparison Structures.
-
“Existing” means that this link exists in the Reference Structure and all the Comparison Structures.
-
“Arc Frequency 100%” means that in 7 out of 7 Comparison Structures, the link was a directed arc from Fever to Loss of Appetite.
-
“Inverted Arc Frequency 0%” means that none of the Comparison Structures contained the inverted arc, i.e., Loss of Appetite to Fever.
-
“Edge Frequency 0%” means that in none of the Comparison Structures, there was an undirected edge between Fever and Loss of Appetite.
-
-
Fever -> Myalgia
-
”->” between the node names means that the link, whenever it is present in any structure, is always a directed arc from Fever to Myalgia.
-
“Added” means that this link does not exist in the Reference Structure but in at least one of the Comparison Structures.
-
“Arc Frequency -28.57%” means that in 2 out of 7 Comparison Structures, the link was a directed arc from Fever to Myalgia.
-
“Inverted Arc Frequency 0%” means that none of the Comparison Structures contained the inverted arc, i.e., Myalgia to Fever.
-
“Edge Frequency 0%” means that in none of the Comparison Structures, there was an undirected edge between Fever and Myalgia.
-
-
Reference Structure
-
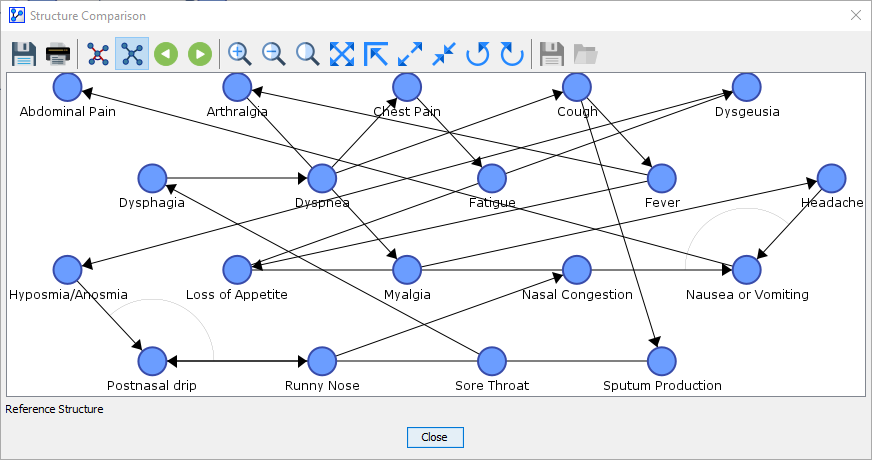
By clicking on the next button , you proceed from the Synthesis Structure to the Reference Structure.
-
Alternatively, you can access the Reference Structure by clicking on the corresponding icon .
-
The Reference Structure represents the original network. Thus, what is displayed is a proper Bayesian network, not merely an illustration.
-
The only visual additions are the circled lines that highlight the V-structures. in the network.
Comparison Structures
-
By clicking on the next button , you proceed from the Reference Structure to the first of potentially many Comparison Structures.
-
The first one is labeled as “Comparison Structure: 0” at the bottom of the window.
-
You can use the previous and next buttons to navigate through the available structures in this order:
-
Synthesis Structure, i.e., the illustration of the differences between the Reference Network and the Comparison Networks.
-
Reference Structure, i.e., the starting point of the analysis that produced all Comparison Networks. See Usage for a list of analysis functions that can produce Comparison Networks.
-
Comparison Structure 0
-
Comparison Structure 1
-
Comparison Structure 2
-
etc.
-
-
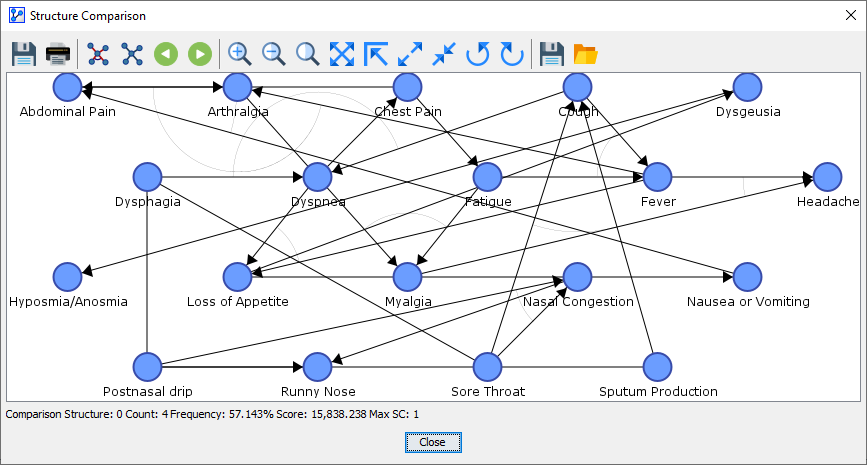
Right underneath the graph area, BayesiaLab reports additional information regarding the displayed Comparison Structure:
-
The sequence number, e.g, 0, 1, etc.
-
The Count, i.e., the number of times the displayed network was produced by the analysis function. In the above screenshot, the shown network was found 4 times.
-
The Frequency, which refers to the count of the displayed network divided by the count of all generated Comparison Structures. Here, the Frequency is 57.143% (=4/7 displayed in percent). Note that the total number of Comparison Structures is not displayed here.
-
The Score, which represents the MDL Score of the currently displayed network.
-
The Structural Coefficient SC, which was used while learning the network of the displayed Comparison Structure. This can important, for instance, when the Comparison Structures are generated by a Structural Coefficient Analysis.
-
-
For Comparison Structures, the Save Network and Open Network icons are available. This allows you to extract the network that is the currently displayed Comparison Structure. Most often, you would want to extract the network with the best score or the network that was found most often, i.e., the “most reliable” structure.