Cluster Interpretation: Tornado Diagram
Background & Context
-
On this page, we present the Tornado Diagram for cluster interpretation as an alternative to Most Relevant Explanations for Cluster Interpretation.
-
To provide further context for Most Relevant Explanations for Cluster Interpretation, we compare several other approaches that can help interpret individual Clusters:
- Setting Evidence for Cluster Interpretation: Posterior Distributions, Relationship with Target Node, Mosaic Analysis, Posterior Mean Analysis, Segment Profile Analysis, Histograms, Tornado Diagrams,
- Optimization for Cluster Interpretation: Dynamic Profile, Target Optimization Tree
-
More specifically, we compare all these approaches with regard to characterizing the state of the Cluster Node in the reference network.
-
All analyses and instructions on this page refer to this reference network, which you can download here:
MaleClusters.xbl
Tornado Diagrams
-
To start Tornado Diagrams, select
Main Menu > Visual > Target > Target's Posterior > Total Effects. -
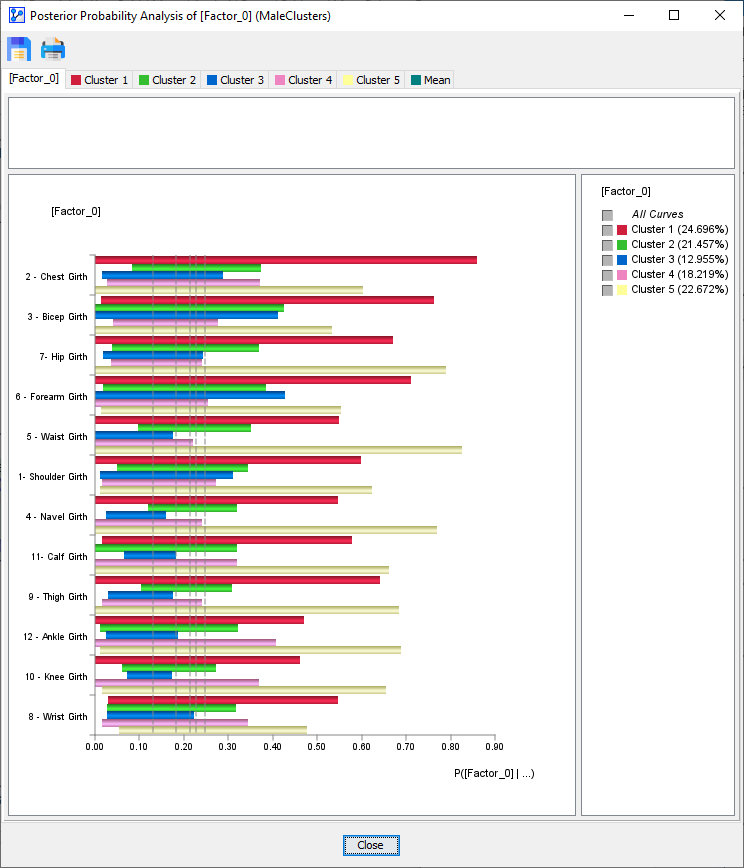
The Tornado Diagram window opens up and presents an overview of all Clusters:
-
Given our interest in , we select the corresponding tab in the window.
-
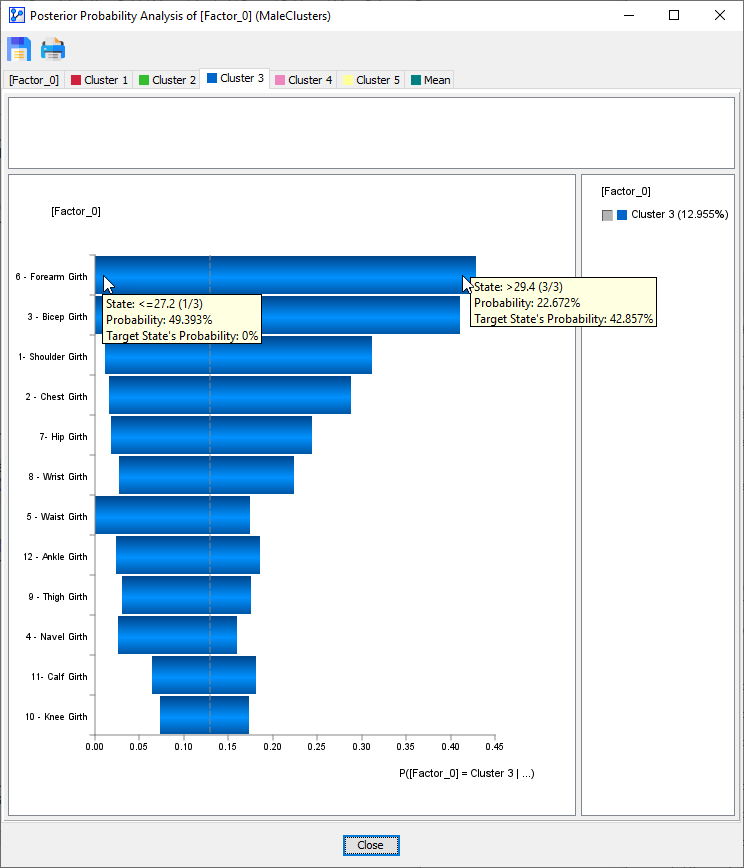
Each manifest node is associated with a blue horizontal bar that visualizes the impact that node can have with regard to membership in .
-
Starting with the top node, , we see that its value range can reduce the probability of membership in to 0% and increase the probability of membership in to 42.857%.
-
Among all nodes, it has the biggest sway over membership in .
-
At the bottom end, , appears to have the least impact on membership in . It can only change the membership probability by 10 percentage points.
-
For reference, the gray dashed vertical line indicates the a priori probability of membership in , i.e., 12.96%.
-
With this reference point, we can see the upside and downside potential of a node. For instance, can bring the membership probability down to 0%, but only lift it 5 percentage points beyond the a priori probability of 12.96%.