Scatter of Points (3+1D)
Context
The Scatter of Points (3+1D) is the three-dimensional version of Scatter of Points (3D).
Usage
-
You can access the Scatter of Points (3+1D) function in multiple ways:
Main Menu > Data > Charts > Scatter of Points (3+1D)Node Context Menu > Charts > Scatter of Points (3+1D)
-
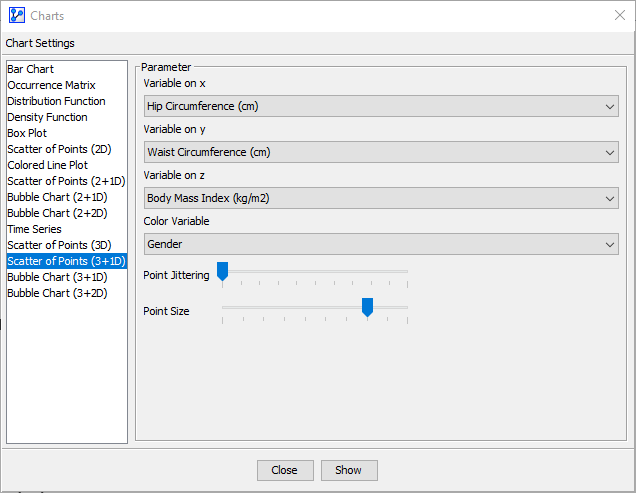
In the Parameter panel:
- Select the variables from the dropdown lists:
- Pick the Variable on x.
- Pick the Variable on y.
- Pick the Variable on z.
- If you had nodes selected when you opened the Charts window, the variables in the dropdown menus are restricted to that selection.
- Select the variables from the dropdown lists:
-
Apply Point Jittering if appropriate:
- The Point Jittering slider allows you to add random noise to the position of each point to reduce overlap when many observations have the same coordinates, which is the case with integer variables, for instance.
- The Point Jittering remains the same at all zoom levels.
-
Choose the Point Size.
-
Click
Show.
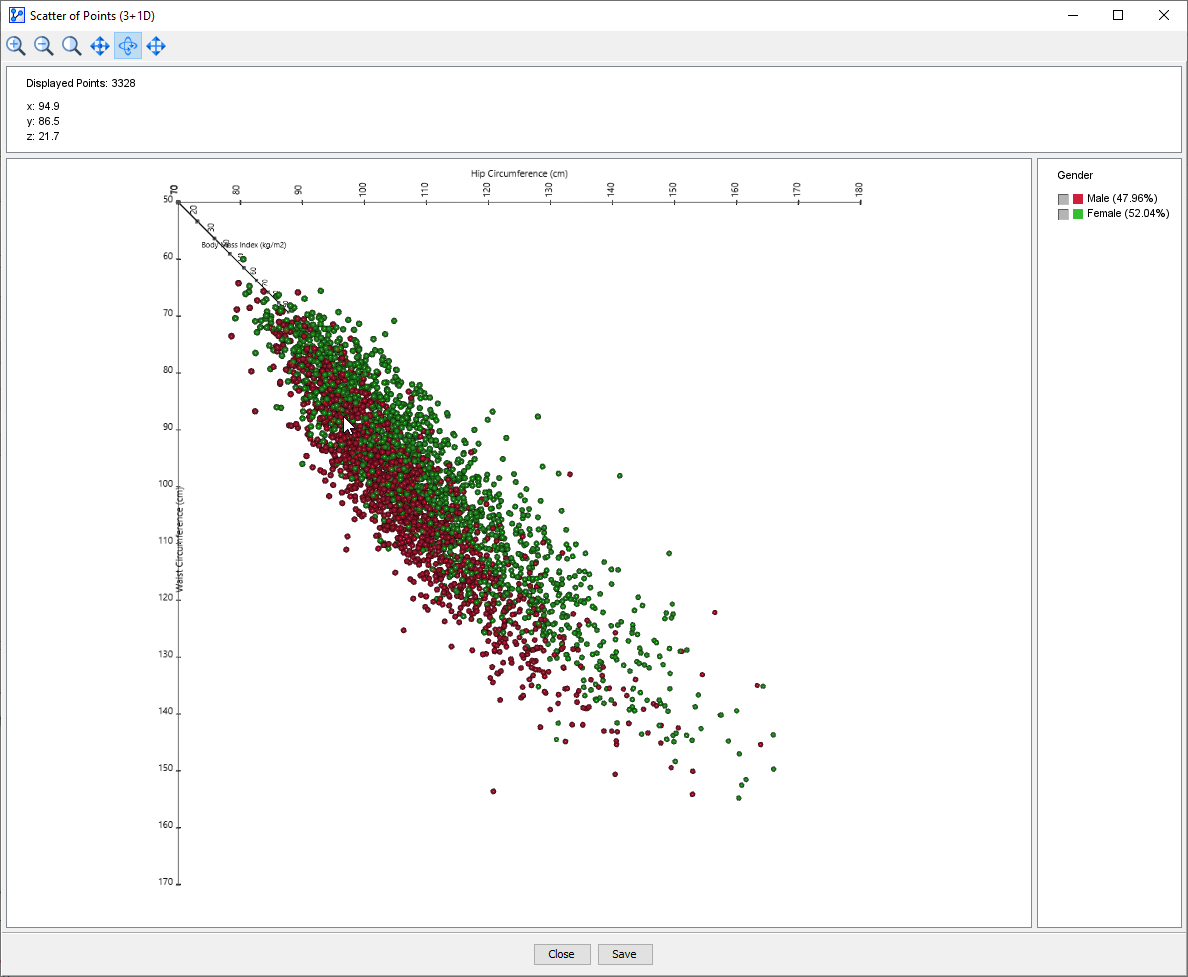
- At the top of the chart window, the Information Panel reports the total number of plotted points.
- In all plots, the Information Panel also shows the cursor coordinates. Here, however, the x, y, and z-values are only shown for the point over which you hover with your cursor.

- To zoom in to the chart, scroll up with the mouse wheel. To zoom out, scroll down with the mouse wheel. This scroll direction is based on the default Windows scroll behavior. For Mac users, the inverse directions apply.
- Alternatively, you can use the Zoom In icon and the Zoom Out icon at the top of the window.
- To return to the default zoom level, click the Default Zoom icon .
- If you click on a particular point, a pop-up window shows all the corresponding records. Note that a larger point size will make it easier to click on a point of interest.
- You can rotate the plot by clicking and holding the left mouse button and then dragging the cursor until the desired view is achieved. By default, this rotation mode is active. If you need to return to this mode, click the Rotate icon .
- To move the plot in parallel to the viewing surface, i.e., your screen, click the Move icon at the top of the window. Then, click and hold the left mouse button and drag the plot into the desired position.
- To return to the default view, which recenters the plot on the screen, click the Centered Position icon .
Demo Files
NHANES_DEMO_BMX.xbl