Dataset Reports
The Dataset Report provides descriptive statistics for the dataset associated with the currently open Graph Window. You can access this report from the context menu by right-clicking the database icon in the Status Bar.
The first part of the report covers the database as a whole.
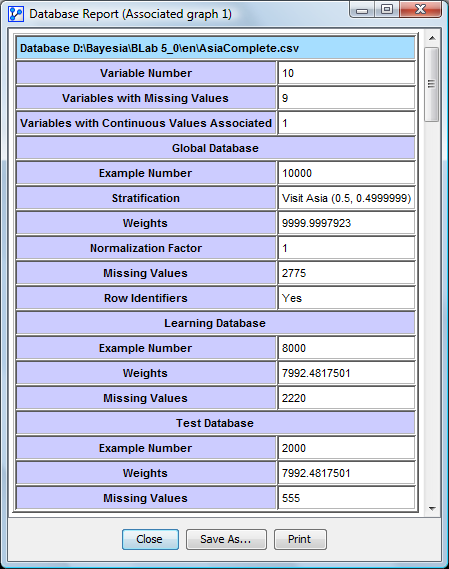
It shows:
- The number of variables.
- The number of variables with missing values.
- The number of continuous variables.
The overall dataset analysis includes:
- The number of examples (i.e., samples, records, or rows).
- If the database contains a stratified node, the corresponding probability distribution is shown.
- If the database has associated weights, the sum of weights and the normalization factor of the weights are displayed.
- The number of missing values and whether the database has row identifiers.
If a data type is defined for the database (e.g., designating each record as either “learning/training” or “test”), the report displays:
- For each set, the number of samples, the sum of the weights, and the number of missing values.
The second part of the Dataset Report provides summary statistics for each variable:
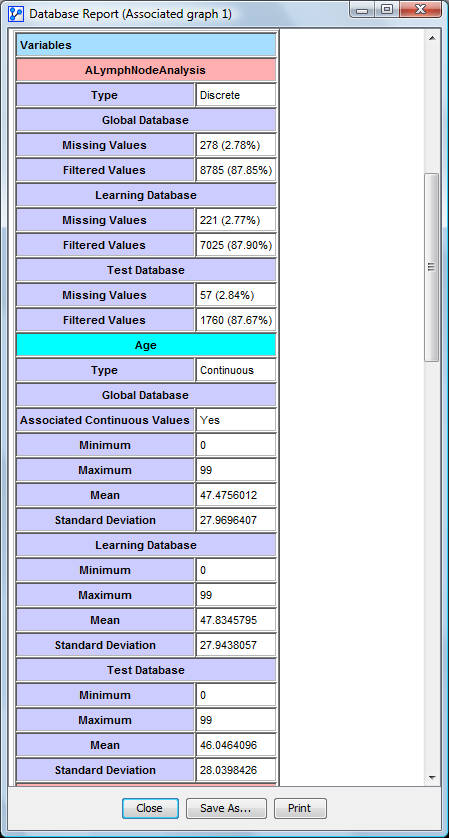
It includes:
- For both discrete and continuous variables:
- The number of missing and filtered values, plus their percentages.
- For continuous variables:
- Whether they have associated continuous values.
- The minimum, maximum, and mean values.
All of the above information is provided for the dataset as a whole and, if applicable, separately for the learning and test subsets of the dataset.