Cluster Interpretation: Target Optimization Tree
Background & Context
- On this page, we present the Target Optimization Tree for cluster interpretation as an alternative to Most Relevant Explanations for Cluster Interpretation.
- To provide further context for Most Relevant Explanations for Cluster Interpretation, we compare several other approaches that can help interpret individual Clusters:
- Setting Evidence for Cluster Interpretation: Posterior Distributions, Relationship with Target Node, Mosaic Analysis, Posterior Mean Analysis, Segment Profile Analysis, Histograms, Tornado Diagrams,
- Optimization for Cluster Interpretation: Dynamic Profile, Target Optimization Tree
- More specifically, we compare all these approaches with regard to characterizing the state Cluster 3 of the Cluster Node Factor\_0\ in the reference network.
- All analyses and instructions on this page refer to this reference network, which you can download here:
MaleClusters.xbl
Target Optimization Tree for Cluster Interpretation
- In addition to the optimization approach shown on the previous page for the Dynamic Profile approach, we now consider the Target Optimization Tree.
- With Dynamic Profile, we obtained the "single-fastest" way for a subject to get into C3.
- However, the resulting profile may provide an idealized and, therefore, limited portrait of a C3 man.
- Instead, we now want to create several sketches of subjects, that are, for practical purposes, an equally good fit for C3.
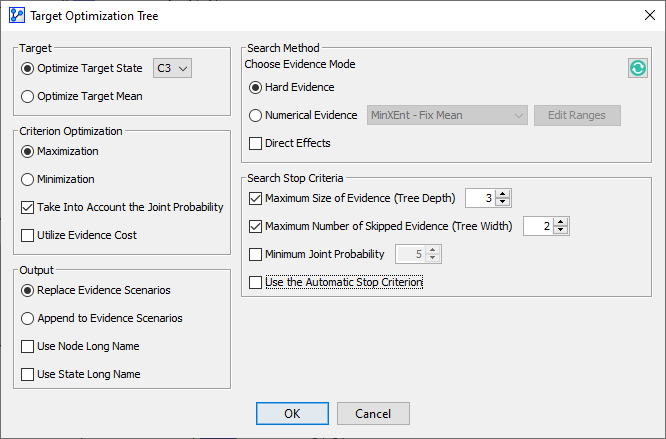
- To start the Target Optimization Tree, select Main Menu > Analysis > Target Optimization > Tree.
- As with the Dynamic Profile, we need to specify the Target State as C3 in the Target Optimization Tree Settings:
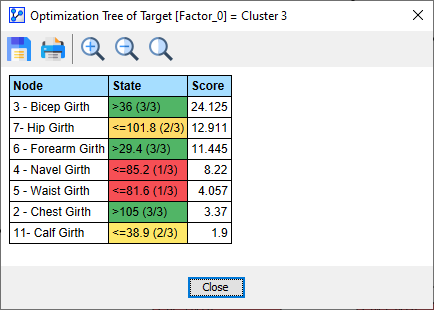
- Upon confirming the settings with OK, BayesiaLab produces the following Optimization Tree, which is shown outside its window for visual clarity:

- This tree highlights multiple pathways to "get into" C3 with an 85% or higher probability.
- So, proceeding from the top, through any of the branches to any of the endpoints at the bottom, assembles the characteristics of a prototypical C3 man. In other words, each path provides a useful sketch.
- To conclude, BayesiaLab offers a report that summarizes the weights of all these sketches.
- Clicking the Report button at the bottom of the Optimization Tree window brings up the Report window: