Cluster Interpretation: Dynamic Profile
Background & Context
- On this page, we present the Dynamic Profile for cluster interpretation as an alternative to Most Relevant Explanations for Cluster Interpretation.
- To provide further context for Most Relevant Explanations for Cluster Interpretation, we compare several other approaches that can help interpret individual Clusters:
- Setting Evidence for Cluster Interpretation: Posterior Distributions, Relationship with Target Node, Mosaic Analysis, Posterior Mean Analysis, Segment Profile Analysis, Histograms, Tornado Diagrams,
- Optimization for Cluster Interpretation: Dynamic Profile, Target Optimization Tree
- More specifically, we compare all these approaches with regard to characterizing the state Cluster 3 of the Cluster Node Factor\_0\ in the reference network.
- All analyses and instructions on this page refer to this reference network, which you can download here:
MaleClusters.xbl
Dynamic Profile for Cluster Interpretation
- We can use BayesiaLab's optimization tools to work with more complex sets of evidence. One of these optimization tools is the Dynamic Profile.
- The Dynamic Profile uses a greedy search algorithm for simulating sets of evidence for maximizing the probability of Cluster 3.
- It may seem counterintuitive to think of optimizing evidence to achieve membership in Cluster 3. After all, we cannot modify body measurements.
- However, we can think of those characteristics, which assign a subject to Cluster 3 most quickly, as prototypical traits of Cluster 3.
- To start Dynamic Profile, select Main Menu > Analysis > Target Optimization > Dynamic Profile.
- In the Dynamic Profile Settings, we need to specify that we want to maximize the probability of Cluster 3 by searching across Hard Evidence.
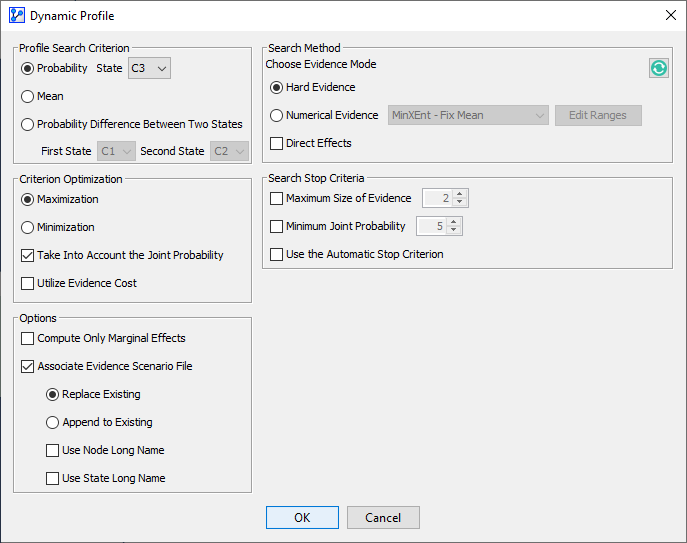
- Clicking OK starts the search and quickly produces a solutions table, which opens up in a new window:
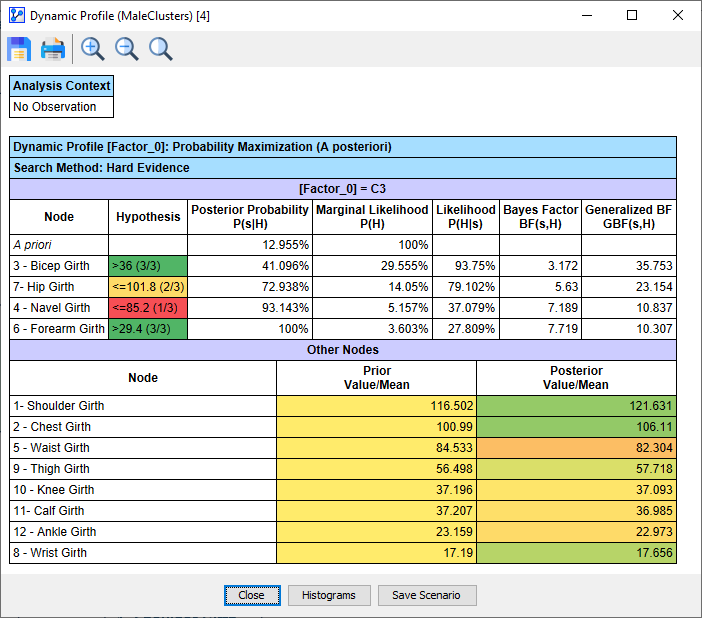
- The starting point is the row in the table marked A priori, which shows that , i.e., the marginal probability of C3.
- If we were to evaluate the hypothesis, 3 - Bicep Girth>36, the posterior probability would increase, i.e., .
- In this case, the Bayes Factor is 3.172, meaning that with this hypothesis, a C3 membership is 3.172 times more probable than without.
- Setting 7 - Hip Girth≤101.8, the probability of C3 membership increases further to 72.938%.
- With 4 - Navel Girth≤85.2 and 6 - Forearm Girth>29.4, we reach a C3 probability of 100%.
- As a result, we can interpret this set of evidence as a prototypical profile of a subject in C3:
- 3 - Bicep Girth>36
- 7 - Hip Girth≤101.8
- 4 - Navel Girth≤85.2
- 6 - Forearm Girth>29.4