Example: Most Relevant Explanations for Cluster Interpretation
Context & Background
-
The purpose of this example is to present the Most Relevant Explanations function as a practical tool for cluster interpretation.
-
This example is based on a Data Clustering exercise, which grouped 247 physically active men according to 12 body measurements.
-
In other words, individuals with similar measurements were grouped together into clusters, so that each cluster represents a certain build or physique.

-
In technical terms, the Data Clustering exercise generated a latent node, Factor\_0\, based on 12 manifest nodes representing the body measurements observed in the population.
-
The latent node, Factor\_0\, contains 5 states, Cluster 1 (C1) through Cluster 5 (C5), with each cluster representing a particular body type.

-
You can download this network via the following link: MaleClusters.xbl
-
For these Clusters, we now want to develop concise profiles so that they can be easily interpreted. For instance, a description of Cluster X might be "big and tall," whereas for Cluster Y, it would be "short and thin."
-
We are specifically interested in the profile of cluster C3. In our dataset, Cluster C3 corresponds to approximately 13% of the subjects.
-
The ultimate objective of this example is to demonstrate Most Relevant Explanations function for this purpose.
Alternative Methods for Cluster Interpretation
However, before we proceed to the Most Relevant Explanations function below, we need to reference several approaches that are available in BayesiaLab for cluster interpretation.
Given that the manifest nodes are connected with Factor\_0\ in a naive Bayesian network, we can run a wide range of queries and simulations to examine the characteristics of the Clusters:
- Cluster Interpretation: Dynamic Profile
- Cluster Interpretation: Mosaic Analysis
- Cluster Interpretation: Histograms
- Cluster Interpretation: Posterior Distributions
- Cluster Interpretation: Posterior Mean Analysis
- Cluster Interpretation: Relationship with Target Node
- Cluster Interpretation: Segment Profile Analysis
- Cluster Interpretation: Target Optimization Tree
- Cluster Interpretation: Tornado Diagram
Please review these methods as context for the Most Relevant Explanations described below:
Most Relevant Explanations for Cluster Interpretation
- Before starting the function, we must set evidence, as Most Relevant Explanations is a tool to explain evidence that is observed.
- Given our interest in Cluster 3, we set .

- To initiate Most Relevant Explanations, select Main Menu > Analysis > Report > Evidence > Most Relevant Epxlanations.
- In the Settings window, we specify:
- All Nodes
- Filtering Power: 0
- Return the n Best Solutions: 10
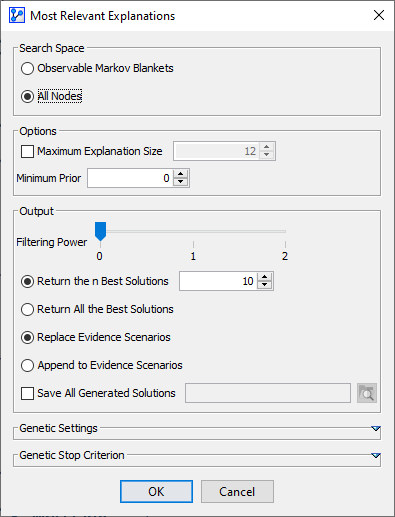
- Upon clicking OK, BayesiaLab starts the search and quickly brings up a report showing a list of solutions, i.e., explanations.
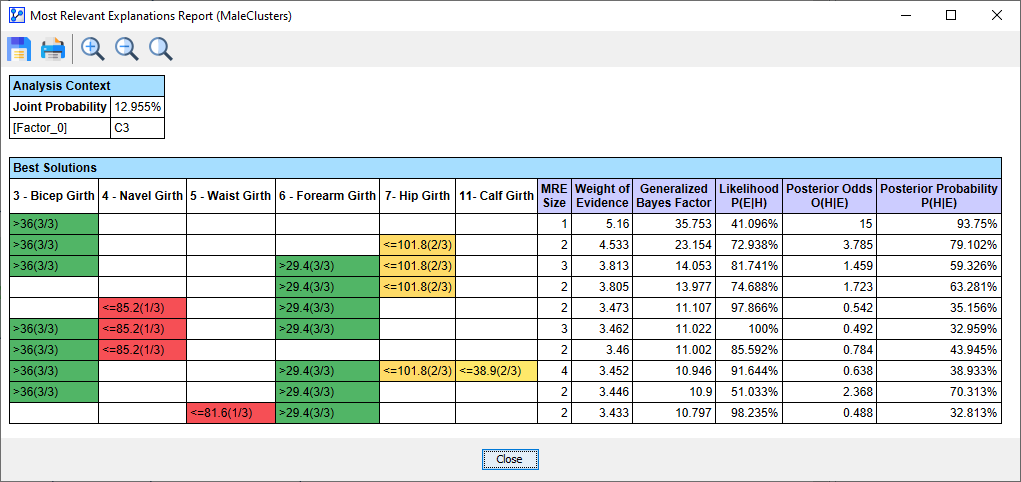
- This presented the most relevant explanation H* for the evidence E=Factor\_0\, i.e., 3 - Bicep Girth>36.
- In the context of profiling, the latent node Factor\_0\ cannot be considered as causal.
- Thus, we need to interpret the Generalized Bayes Factor as the Odds Ratio: the Conditional Odds of 3- Bicep girth>36 given are almost 36 times higher than the Marginal Odds, i.e., 15 versus 0.42.
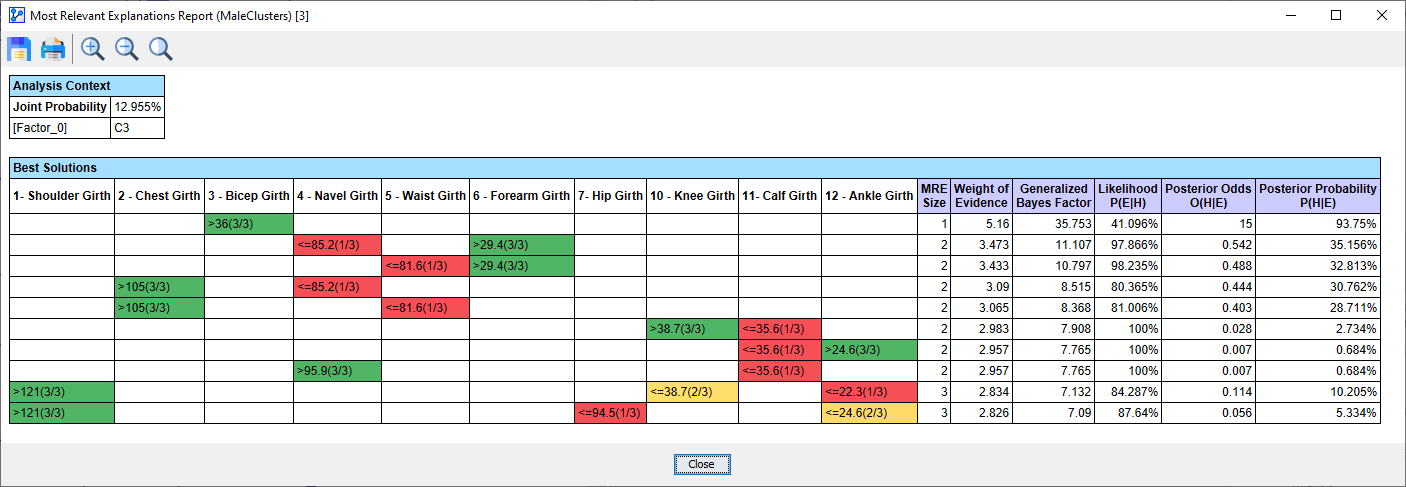
Filtering Solutions
- For focusing the report on truly relevant solutions, you can select the Filtering Power for producing the report.
Filtering Power=0 (No Filtering)
Filtering Power=1 (Strongly Dominated Solutions are Filtered)
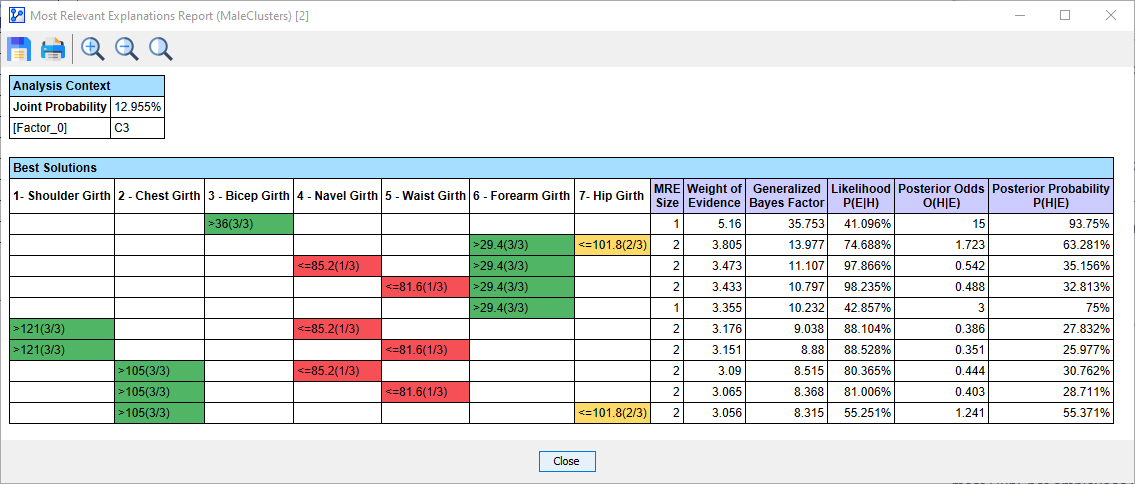
Filtering Power=2 (Strongly and Weakly Dominated Solutions are Filtered)