Cluster Interpretation: Mosaic Analysis
Background & Context
- On this page, we present the Mosaic Analysis for cluster interpretation as an alternative to Most Relevant Explanations for Cluster Interpretation.
- To provide further context for Most Relevant Explanations for Cluster Interpretation, we compare several other approaches that can help interpret individual Clusters:
- Setting Evidence for Cluster Interpretation: Posterior Distributions, Relationship with Target Node, Mosaic Analysis, Posterior Mean Analysis, Segment Profile Analysis, Histograms, Tornado Diagrams,
- Optimization for Cluster Interpretation: Dynamic Profile, Target Optimization Tree
- More specifically, we compare all these approaches with regard to characterizing the state Cluster 3 of the Cluster Node [Factor_0] in the reference network.
- All analyses and instructions on this page refer to this reference network, which you can download here:
MaleClusters.xbl
Mosaic Analysis for Cluster Interpretation
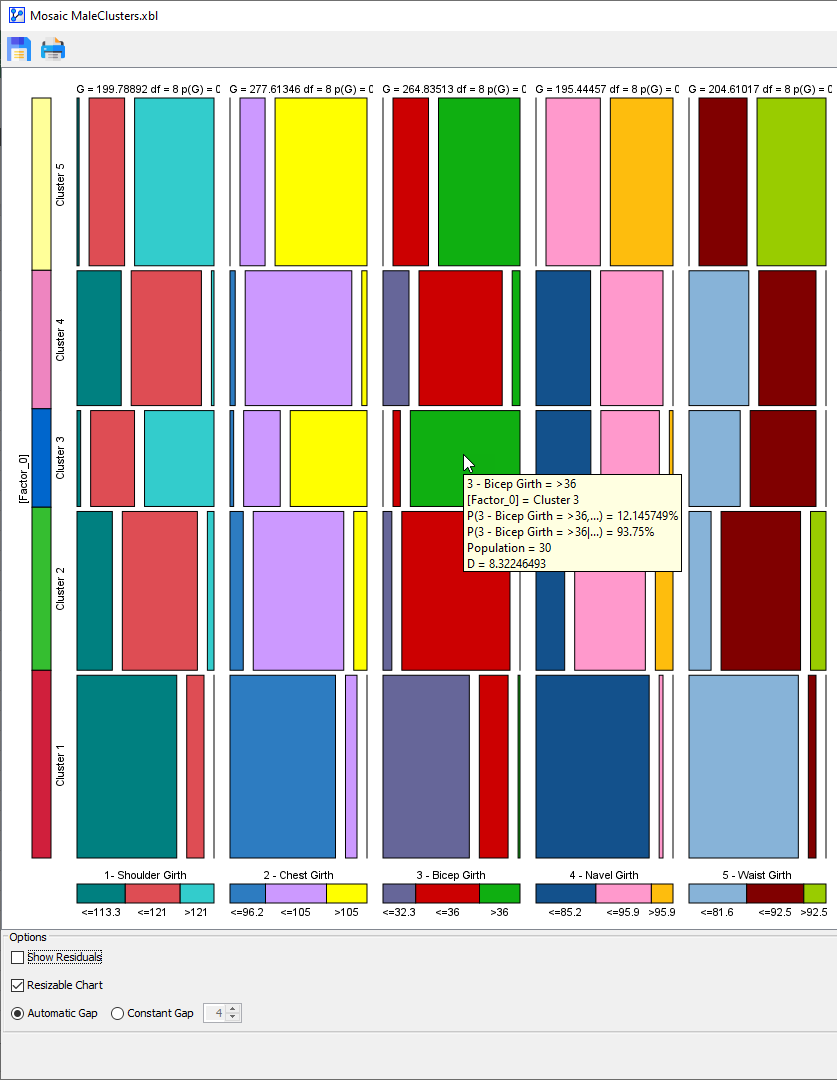
- With the Mosaic Analysis, we can visualize the posterior probability distributions of all nodes for each Cluster.
- Select all nodes in the network, including the Cluster Node Factor\_0\.
- To start the Mosaic Analysis, select Main Menu > Analysis > Visual > Overall > Mosaic.
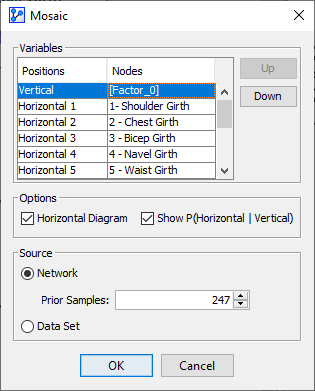
- In the Settings window, we assign Factor\_0\ to the vertical axis.
- Upon clicking OK, BayesiaLab opens a new window showing the Mosaic Analysis.
- In the above window, the row of boxes corresponding to is highlighted with a purple frame.
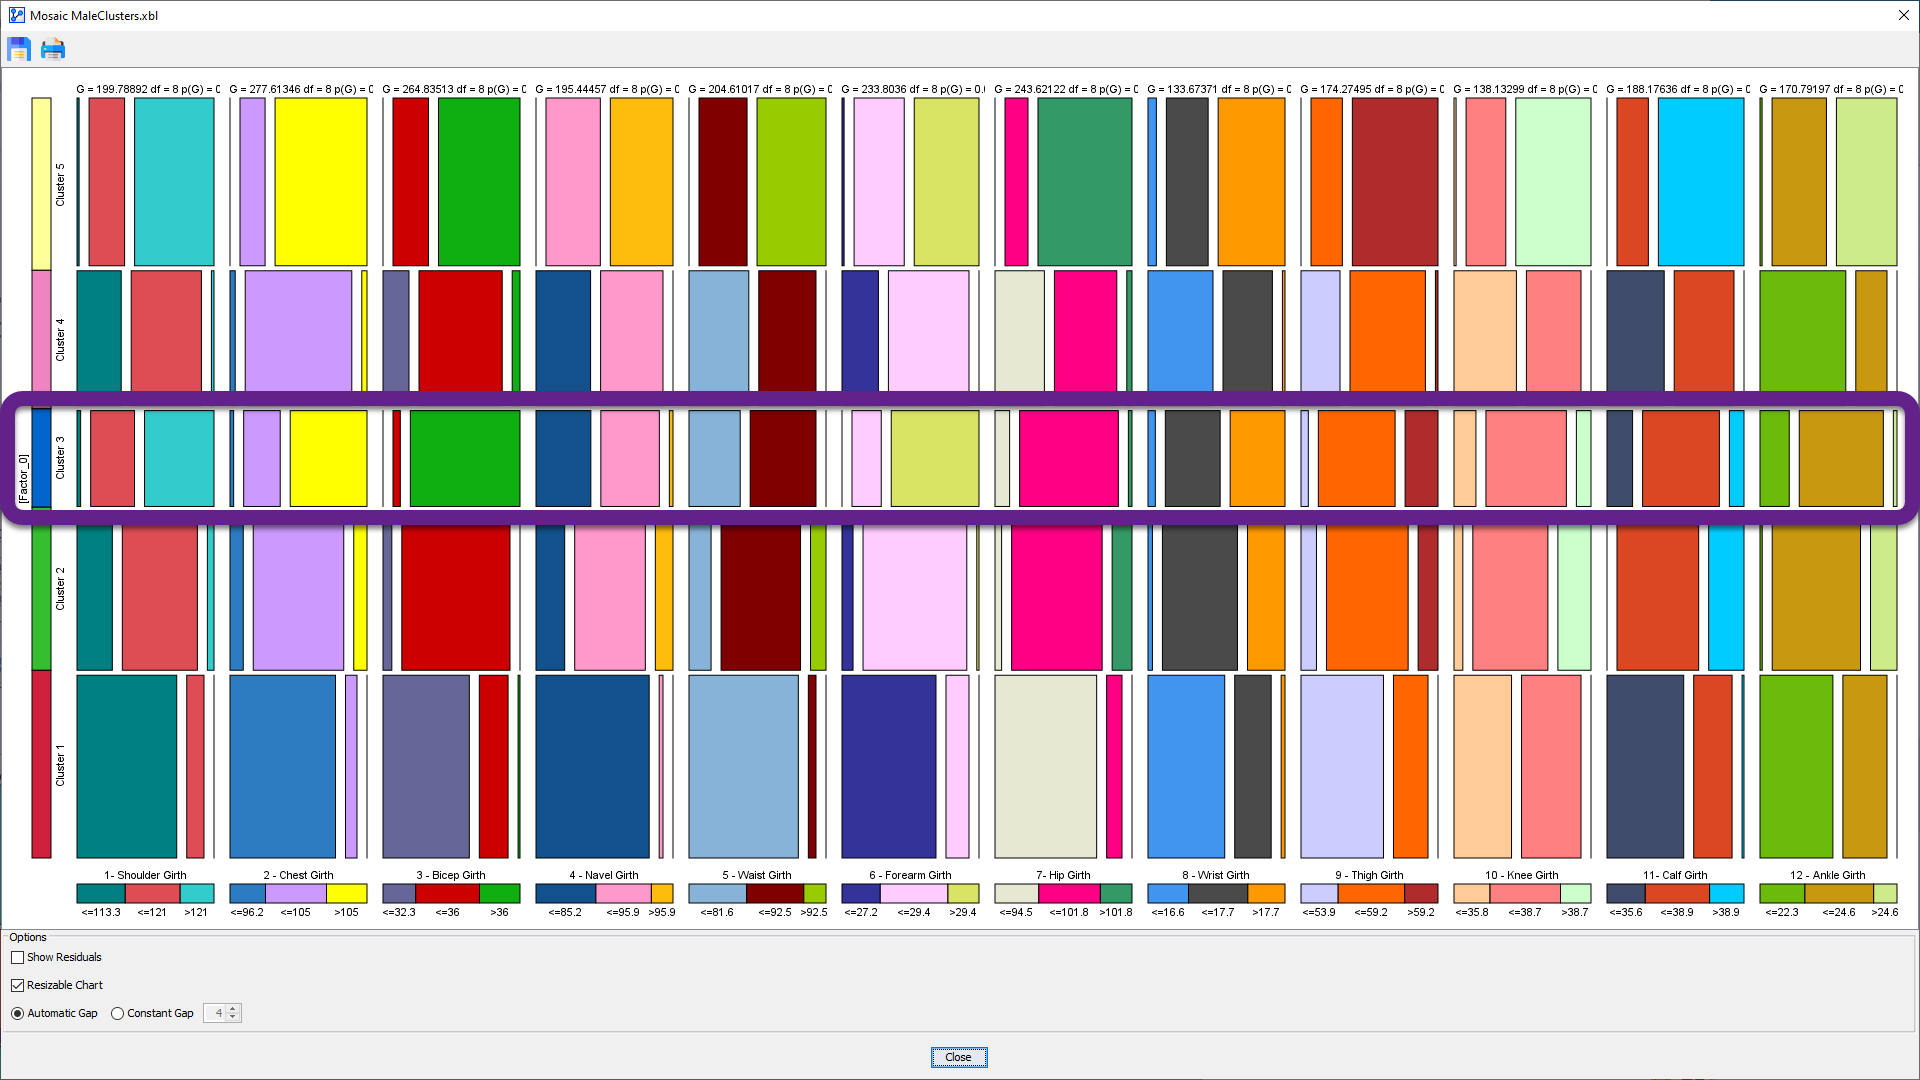
- In the following screenshot, we zoom in to focus on the box that represents :