BayesiaLab 11.8 is Here
What’s New?
This summer brings the release of BayesiaLab 11.8, Bayesia’s flagship software. The release focuses on Hellixia, BayesiaLab’s fully integrated GenAI assistant, which expands its capabilities in mining knowledge from LLMs to build Bayesian networks, semantic networks, and knowledge graphs. What sounded like science fiction until recently is now a built-in workflow: generating a causal graph directly from narratives, derived from LLMs alone or in conjunction with your documents.
Updated Propositional Causal Bayesian Network Generators
MenusHellixiaPropositional Causal Bayesian Network Generator MenusHellixiaAutomatic Propositional Causal Bayesian Network Generator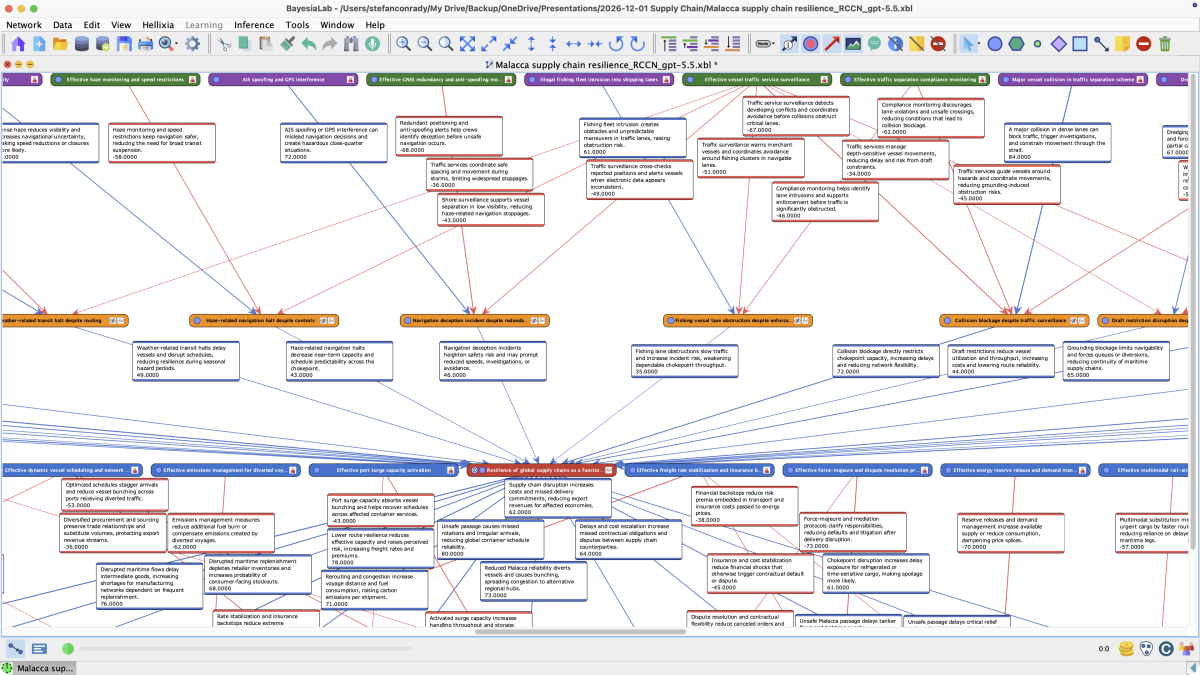
Generating causal models from LLM-based knowledge has been a key Hellixia feature since its introduction. Its latest iteration brings important improvements to two menu items:
- Propositional Causal Bayesian Network Generator
- Automatic Propositional Causal Bayesian Network Generator
As their names imply, these functions produce a fully specified Bayesian network whose nodes represent propositions (True/False) and whose arcs carry direct causal effects. These functions were previously named Causal Bayesian Network Generator and Automatic Causal Bayesian Network Generator; the updated names emphasize the propositional nature of the resulting networks.
The new terminology also distinguishes these functions from the Automatic Bayesian Network Generator, which produces unconstrained Bayesian networks, i.e., without restrictions on variable type (Discrete or Continuous) or number of states.
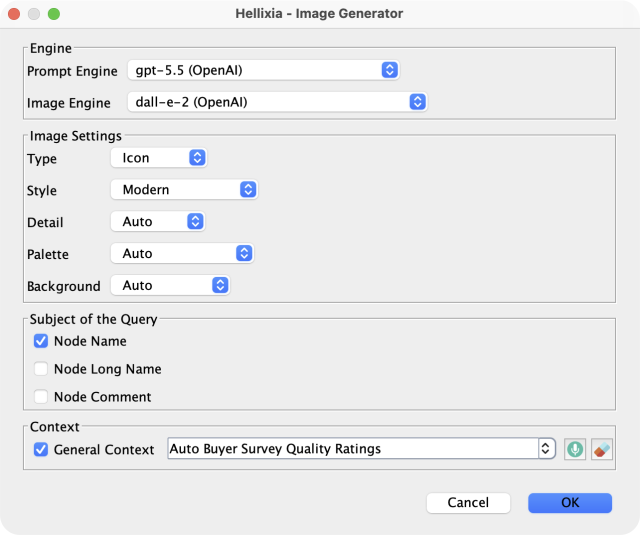
New Image Generator
MenusHellixiaImage GeneratorBayesiaLab already stores rich metadata for each element of a graph, so using LLMs to turn that metadata into visuals is a natural extension. Hellixia can prompt LLMs with node names and free-form node comments to generate images and icons in any style you wish, reinforcing the visual, intuitive character of graphs and making them even easier to read.
In BayesiaLab 11.8, the Image Generator has been redesigned around a two-pass process:
Prompt Engine to create a textual description of the image from any of the node’s available information, i.e., Node Name, Long Name, Node Comment.Image Engine to generate an image on the basis of the newly-created description.Previously, the Image Generator used the Node Name, Long Name, or Node Comment directly, without creating intermediate prompts first. This unfiltered and uninterpreted use of node descriptions didn’t always suffice as a prompt for LLMs. As a workaround, you often had to rewrite the Node Comment manually to include a more prompt-like image description. Only then did the LLMs have enough of a prompt to go on for creating an image.
Now, this manual workaround is no longer necessary. The first pass of the Image Generator translates the node’s information into a proper visual description, even for concepts that are difficult to depict. As a result, you can get high-quality visuals with no extra effort.
New Evidence Scenario Generator
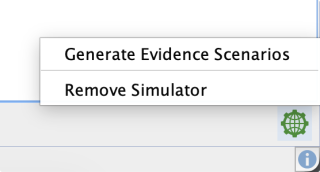
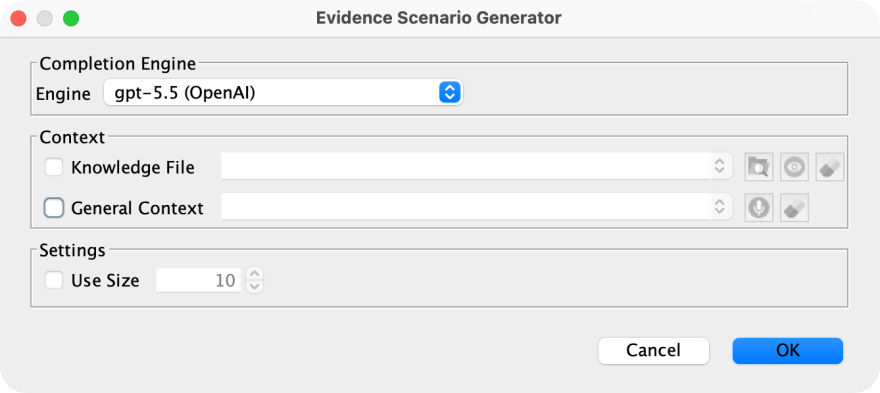
BayesiaLab can now generate Evidence Scenarios automatically for later simulation.
If you have set up a WebSimulator for a network, as indicated with the WebSimulator icon and nodes specified under the Inputs tab in the WebSimulator Editor, BayesiaLab can use these nodes to generate scenarios using LLMs plus any content you provide.
For instance, when relevant historical information is available from LLMs, the scenarios would be taken from real-world events. For instance, when modeling supply chain risk as a function of maritime traffic, the 2021 Suez Canal obstruction would likely be reflected in one of the generated scenarios.
This is especially useful for models built from expert knowledge or LLMs: simulating real-world scenarios gives you a way to assess the model’s plausibility.
You can also share these generated scenarios with the WebSimulator, so its end users can start their experimental simulations with realistic baselines instead of purely hypothetical conditions.
Translator — Complete Redesign
MenusHellixiaTranslatorHellixia’s Translation feature has been completely overhauled. Previously, you had to select which specific elements to translate, such as Node Names or States. It is now far more comprehensive, covering all network components, including:
- Node Comments
- Arc Comments
- Network Comments
- Node Classes
Support for the Latest LLMs
Hellixia now supports the most recent LLMs, such as GPT 5.5, Opus 4.8, and Gemini 3.1.